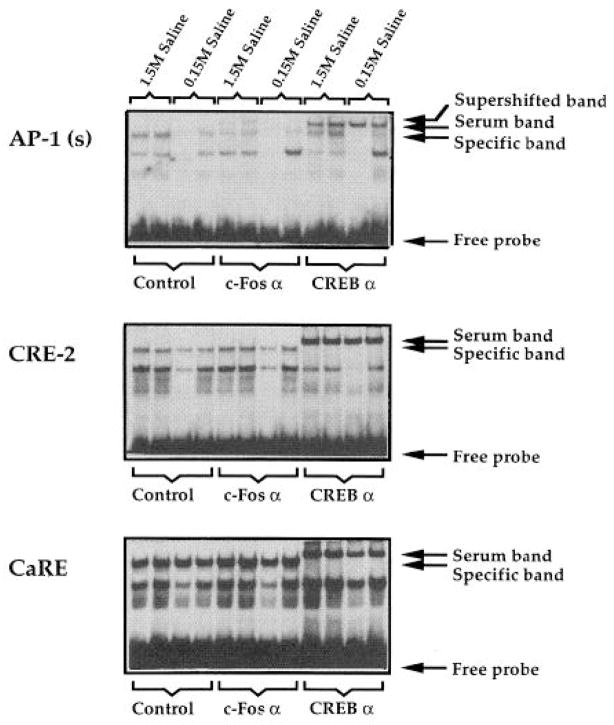
Fig. 9. Gel Shift Analysis in the Presence of c-Fos α and CREB α.
Supershift analysis of proteins binding to the AP-1(s) oligonucleotide (top), the CRE-2 oligonucleotide (middle), and the CaRE oligonucleotide (bottom). A serum band is seen in the presence of CREB antiserum that is not affinity purified (see also Fig. 7 showing the additional band in the presence of serum). Each condition is shown in duplicate, representing entirely independent experiments. Lanes 1–4 show animals treated with hypertonic saline (lanes 1 and 2) and normal saline (lanes 3 and 4) in the absence of antibody. Lanes 5–8 show animals treated with hypertonic saline (lanes 5 and 6) and normal saline (lanes 7 and 8) in the presence of Fos antibody. Lanes 9–12 show animals treated with hypertonic saline (lanes 9 and 10) and normal saline (lanes 11 and 12) in the presence of CREB antiserum.

