
Figure 4. Local Circuit Mechanism Involves Direct Excitation and Indirect Inhibition of BLA-vHPC Synapses.
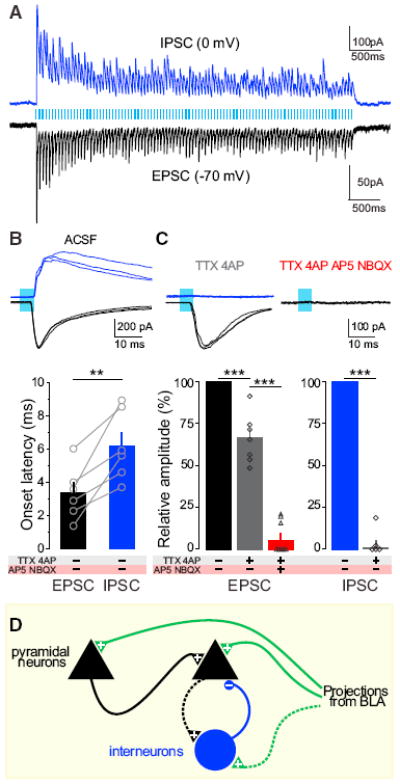
Voltage-clamp experiments in the vHPC neurons of animals expressing ChR2 in BLA neurons. Means are represented as ±SEM. See Figures S4, S7, and S8. (A) Photostimulation of BLA terminals in the vHPC trigger EPSCs and IPSCs as shown in sample traces (20 Hz, 5 ms pulses for 5 s) in a representative neuron clamped at −70 mV and 0 mV, respectively. (B) Overlay of three sample IPSCs and EPSCs; 5 ms light pulses. Bar histogram represents onset latencies, relative to the light-pulse onset. IPSC onset latencies (6.2 ± 0.85 ms) were significantly longer than EPSC latencies (3.4 ± 0.65 ms; one-tailed paired Student’s t test, t = 4.430, n = 6, **p = 0.0034). (C) Overlay of three light-triggered responses during sodium and potassium channel blockade (TTX+4AP) and glutamate receptor blockade (TTX+4AP+AP5+NBXQ). Histogram represents the population analysis of current amplitudes after pharmacological manipulation. EPSCs persist under perfusion of sodium and potassium channel blockers (one-way ANOVA, F2,12 = 145.4, p < 0.0001, TTX+4AP in gray versus ACSF in black, Tukey post hoc analysis, ***p < 0.001), whereas IPSCs are abolished (TTX+4AP in gray versus ACSF in blue, one-tailed paired Student’s t test, n = 5, t = 25.55, ***p < 0.001). GluR antags block the monosynaptic light-evoked EPSC (TTX+4AP, in gray, versus TTX+4AP+AP5+NBQX, in red, Tukey post hoc analysis, ***p < 0.001). (D) Model of the BLA-vHPC circuit activated in ChR2-BLA:vHPC mice. Pyramidal cells receive monosynaptic inputs from BLA, polysynaptic inputs from other pyramidal cells, and inhibition through polysynaptic mechanisms (dotted lines indicate speculated microcircuitry). “+” represents glutamatergic synapses and “−” represents GABAergic synapses.