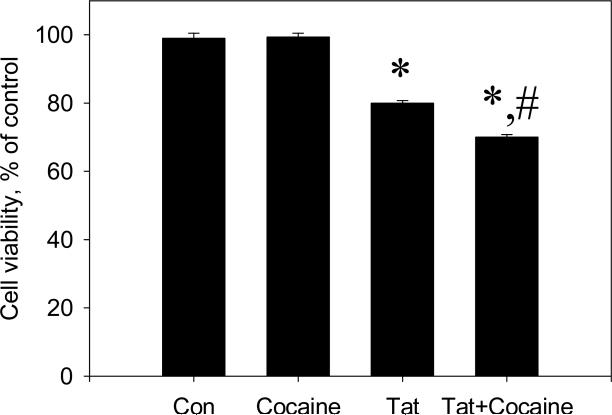
Figure 1.
The effect of cocaine on the toxicity of Tat 1-86 in primary rat fetal midbrain cell culture. Graph represents relative (compared to non-treated controls) changes in Live/Dead ratios 48 hours following the addition of 50 nM Tat 1-86 or 50 nM Tat 1-86 + 1.5 μM cocaine to the cell cultures. Data presented as mean values ± SEM, n of sister cultures analyzed = 7-14 per each variant of treatment. *- marks significant (P<0.05) difference between Tat-treated (50 nM Tat) group and non-treated control group; *,#-marks that this experimental group (50 nM Tat+ 1.5 μM cocaine) was significantly (P<0.05) different from non-treated control (*) and from Tat-treated group (#).

