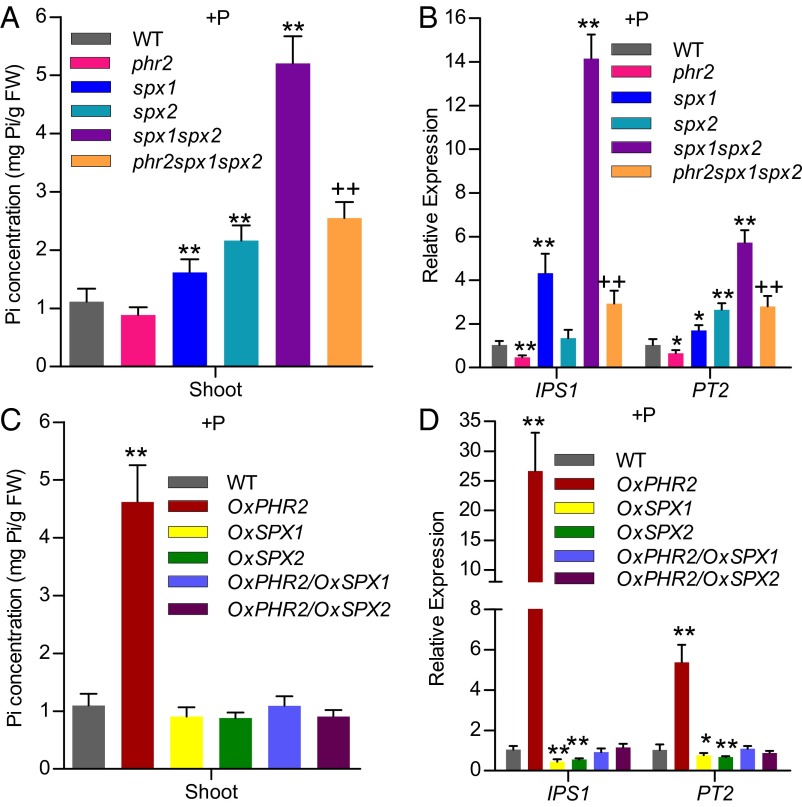
Fig. 3.
SPX1 and SPX2 have redundancy on repressing the Pi concentration and Pi signaling. Shoot cellular Pi concentrations (A) and relative expression of IPS1 and PT2 (B) of 15-d-old WT, phr2, spx1, spx2, spx1spx2, and phr2spx1spx2 plants in Pi-sufficient conditions (+P, 200 μM Pi). Shoot cellular Pi concentrations (C) and relative expression of IPS1 and PT2 (D) of 15-d-old WT, OxPHR2, OxSPX1, OxSPX2, OxPHR2/OxSPX1, and OxPHR2/OxSPX2 plants in Pi-sufficient conditions (+P, 200 μM Pi). Data show mean + SD (n = 5 for A and C, n = 3 for B and D). FW, fresh weight. Data that differ significantly from the corresponding controls are indicated (plants vs. WT: *P < 0.05, **P < 0.01; triple mutant vs. the spx1spx2 double mutant: ++P < 0.01; Student t test).

