Fig. 2.
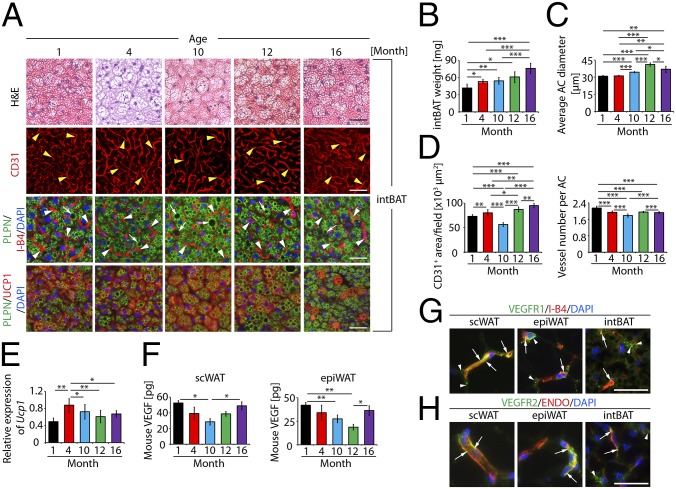
Age-related changes of adipose vasculature and intBAT adipocyte size. (A) Histology of intBAT adipocytes and vascular density. intBAT was stained with H&E, CD31 (red), or PLPN (green) plus I-B4 (red) with DAPI nucleus staining (blue). UCP1 (red), PLPN (green) and DAPI (blue) triple staining is shown in lowest panels. Arrowheads point to microvessels and arrows point to lipid droplets. (Scale bars, 50 μm.) (B) Total weight of intBAT of 1-, 4-, 10-, 12-, and 16-mo-old mice (n = 10–12). (C) Average diameters of intBAT adipocytes. Adipocyte sizes were quantified from 120 adipocytes from 12 fields. (D) Quantification of total vascular density and microvessel numbers per adipocyte in intBAT (12 fields per group). (E) Quantification of Ucp1 mRNA expression by qPCR (six samples in duplicates per group). (F) Quantification of VEGF protein levels in scWAT and epiWAT of different age groups (four samples in duplicates per group). (G) Colocalization of VEGFR1 protein expression with a specific anti-VEGFR1 antibody with I-B4 in scWAT, epiWAT, and intBAT. Arrows indicate VEGFR1 and I-B4 double-positive signals. Arrowheads point to nonoverlapping signals. (Scale bar, 50 μm.) (H) Colocalization of VEGFR2 protein expression with a specific anti-VEGFR2 antibody with endomucin (ENDO) in scWAT, epiWAT, and intBAT of 1-mo-old mice. Arrows indicate VEGFR2 and ENDO double-positive signals. Arrowheads point to nonoverlapping signals. (Scale bar, 50μm.) *P < 0.05, **P < 0.01, ***P < 0.001.

