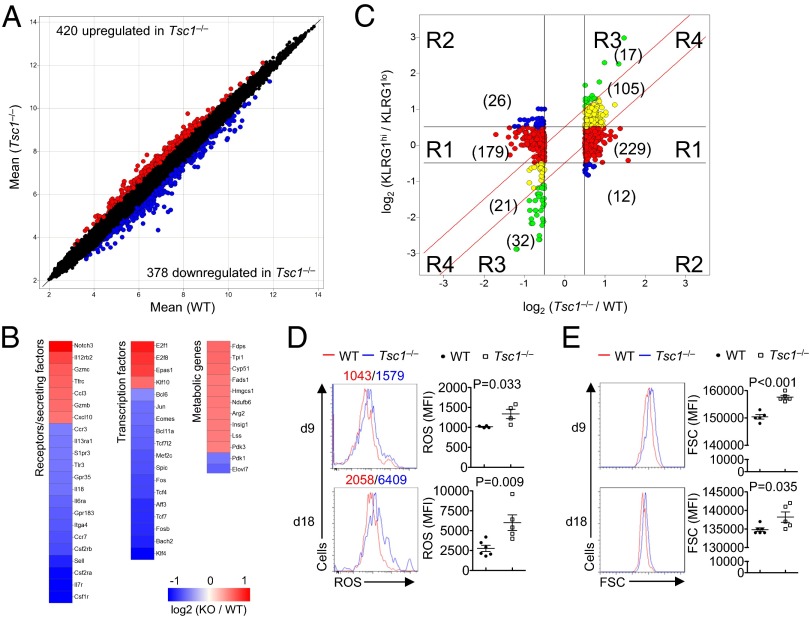
Fig. 5.
Tsc1-dependent gene expression profiles in antigen-experienced CD8+ T cells. (A) Scatterplot comparison of global gene expression profiles between WT and Tsc1−/− Kb-OVA+ CD8+ T cells sorted from mice at day 9 p.i.; transcripts with >0.5 log2 fold change are highlighted (WT, n = 4; Tsc1−/−, n = 5). (B) Heat maps of differentially expressed genes in Kb-OVA+ CD8+ T cells (with >0.5 log2 fold change), with red color denoting up-regulated genes in Tsc1−/− cells and blue color down-regulated genes in Tsc1−/− cells. (C) Comparison of expression changes in Tsc1−/− versus WT cells with those in KLRG1hi versus KLRG1lo cells. The Tsc1 target genes (>0.5 log2 fold change) were partitioned into four main clusters, shown and colored by regions (R1–R4). Numbers within parentheses indicate the number of probes within each subregion. (D and E) ROS production (D) and cell size (E) of splenic Kb-OVA+ CD8+ T cells from WT and Tsc1−/− mice at day 9 and 18 p.i. Data are representative of one experiment (A–C) and two independent experiments (D and E) and are presented as the mean ± SEM.

