Fig. 6.
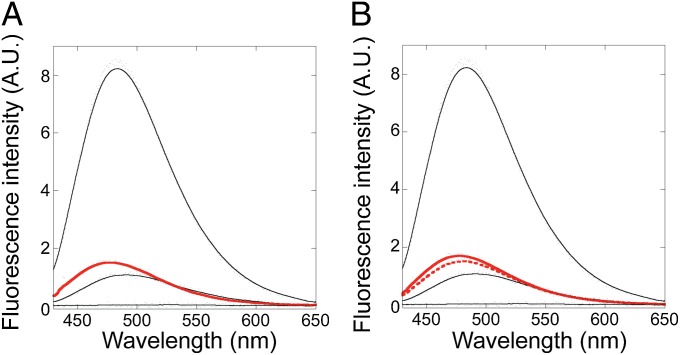
The Icore mimics do not bind the hydrophobic dye ANS. Fluorescence emission spectra of ANS in the presence of (A) the Icore fragment (red) and (B) the Icore full-length mimics FL1 (solid red) and FL2 (dashed red). For comparison, spectra in the presence of full-length wild-type RNase H at pH 1.2 (top black curve), pH 5.5 (middle black curve), and 6 M urea (bottom black curve) are shown in both plots. All experiments were performed with 2 μM protein and 50 μM ANS. The fluorescence emission of ANS in buffer alone has been subtracted from the data.

