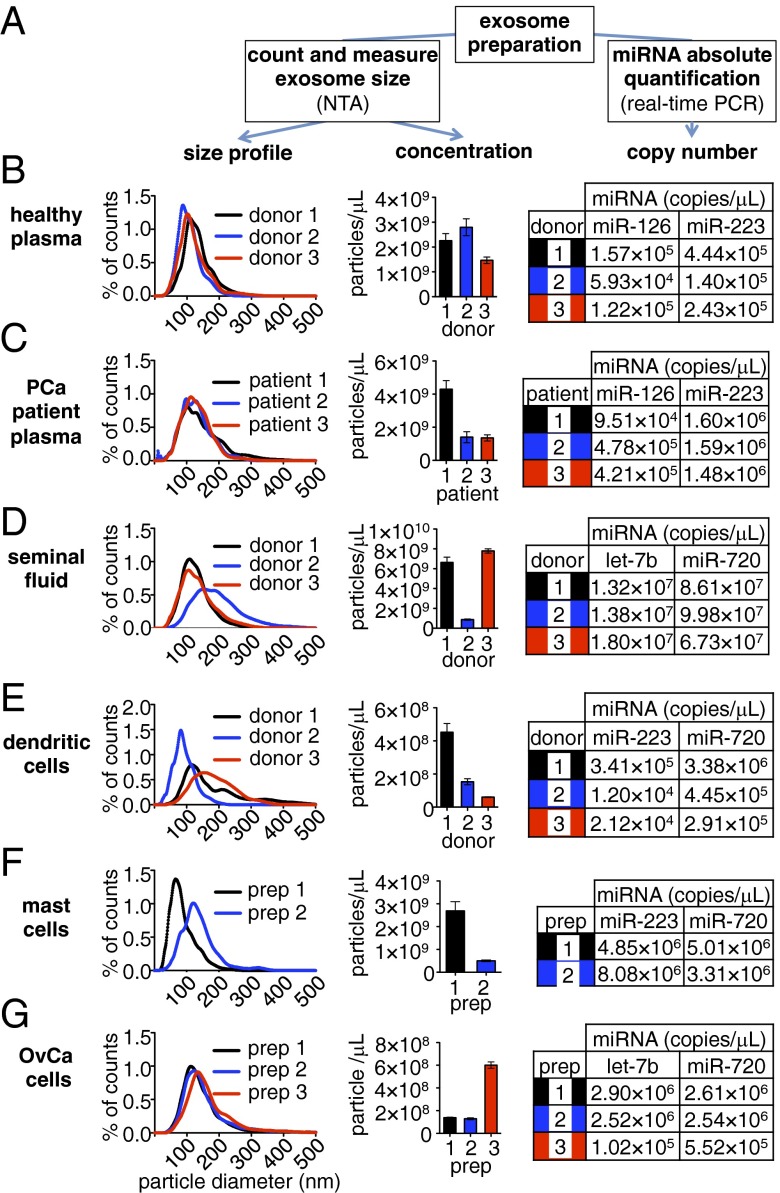
Fig. 3.
Quantification of exosome number, size distribution, and miRNA content. Aliquots of exosome preparations described in Fig. 2 were counted and sized by NTA. In parallel, total RNA was extracted from additional exosome aliquots, and the concentrations of abundant exosomal miRNAs identified in Fig. 2 were determined by real-time PCR. (A) Workflow to determine the size distribution, exosome concentration, and absolute quantification of miRNAs in each exosome sample. (B–G) Exosome size distribution histograms (representing the percentage of total counts found within each 1-nm-sized bin), total particle concentrations, and miRNA concentrations in exosome preparations for (B) healthy (donor) plasma (n = 3 donors), (C) prostate cancer (PCa) patient plasma (n = 3 patients), (D) healthy donor seminal fluid (n = 3 donors), (E) dendritic cells (in vitro differentiated Langerhans cells; n = 3 donors), (F) mast cells (HMC-1 cell line; n = 2 preparative replicates: preparation 1 from serum-free conditioned medium and preparation 2 from exosome-depleted serum containing medium), and (G) ovarian carcinoma (OvCa) cells (2008 cell line; n = 3 preparative replicates). Values represent the concentrations in each exosome preparation (i.e., not the concentration in the crude starting specimen).

