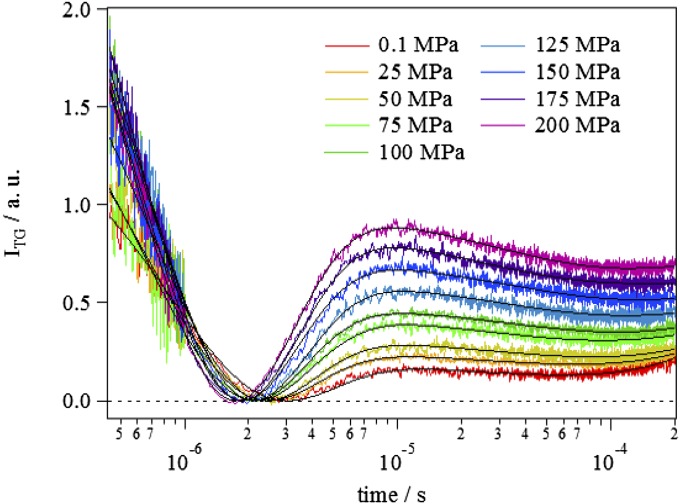
Fig. 2.
Typical TG signals of TePixD in the submillisecond time region, which represents the volume expansion process from the intermediate I1 to I2, recorded at every 25 MPa from 0.1 to 200 MPa (from Lower to Upper) with q2 = 3.5 × 10¹² m−2. Fitting curves based on the fitting function Eq. 1 are shown by black solid lines. Pressures are indicated by the legend in the figure.

