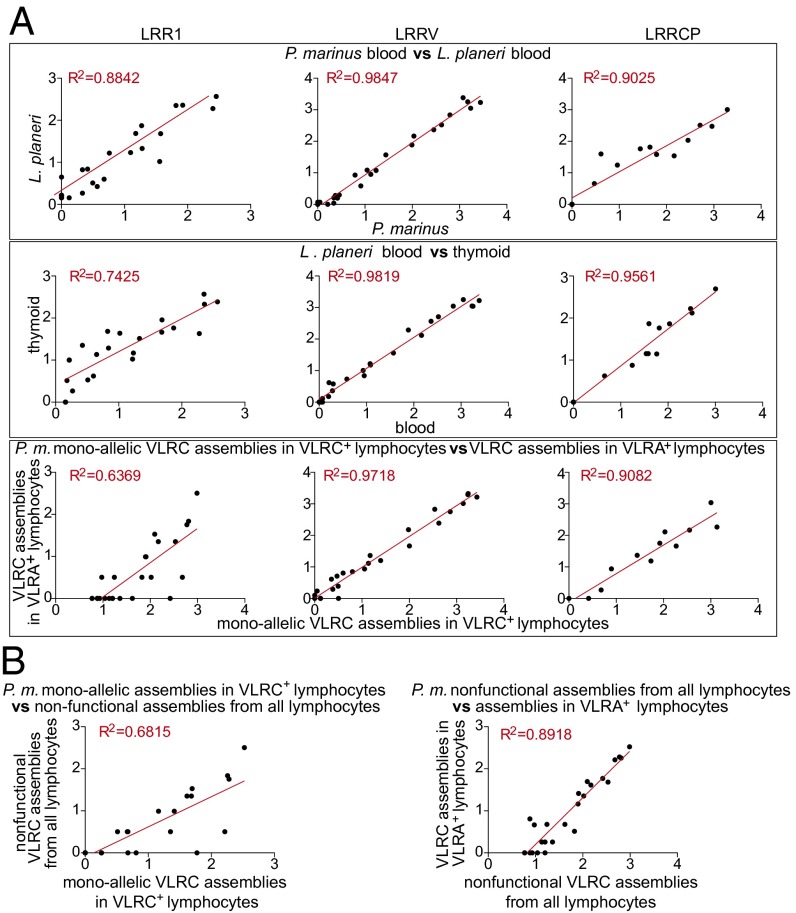
Fig. 5.
LRR1 diversity shows poor correlation between different groups of VLRC assemblies. The relationships of entropy values are displayed as scatterplots (see Fig. 4D) (A and B) for groups of VLRC assemblies described in Fig. 2 A–D and G. The coefficients of determination (R2) are indicated. Significant differences between the different correlation coefficients (R) were assessed using Fisher’s z transformation and are tabulated in Dataset S4. Entropy correlations for LRRV modules did not include LRRVt sequences.

