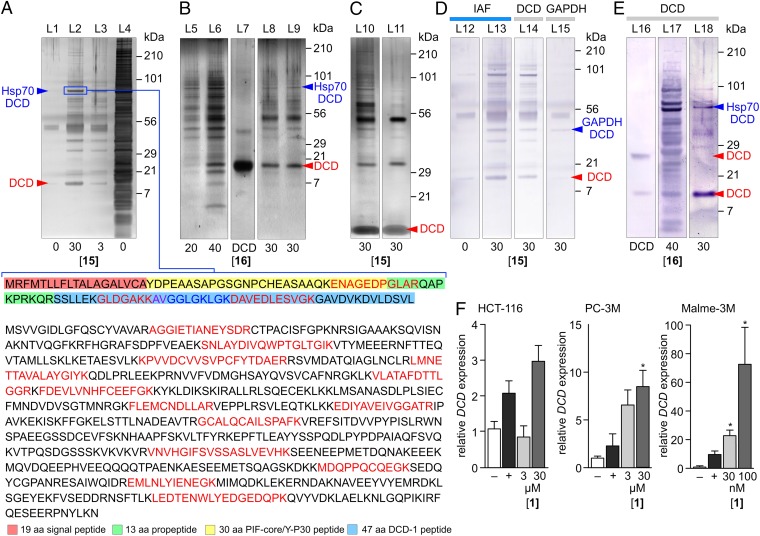
Fig. 4.
Seriniquinone (1) targets DCD. (A) Silver-stained SDS PAGE gel depicting proteins immunoprecipitated from HCT-116 cell lysates treated with 15 over 8 h at 4 °C. This response was dose dependent with an increasing return of immunoprecipitated protein at higher concentrations of 15 (L2 versus L3). Trypsin-digest LC-MS/MS analysis of the protein in a 90-kDa band returned peptides (colored in red or blue) corresponding to DCD (Upper) and Hsp70 (Lower). The DCD-derived, peptides were observed in the 30 aa PIF core, 13 aa propeptide and 47 DCD-1 peptide region (additional data provided in SI Appendix, Fig. S1). (B) Silver-stained SDS/PAGE gel depicting proteins immunoprecipitated from HCT-116 cell lysates treated with 16 at 4 °C over 12 h. DCD in L7 denotes the position of recombinant full length 110 aa DCD protein. (C) Treatment with iodoacetamide blocks the formation of disulfide linkages to DCD. A silver-stained SDS/PAGE gel provided in L10 depicts the proteins immunoprecipitated from HCT-116 cell lysates with 15 over 8 h, then treated with 5 mM iodoacetamide at room temperature for 1 h before SDS/PAGE analysis. A silver-stained SDS PAGE gel provided in L11 depicts the proteins from HCT-116 cell lysates that were treated for 1 h with 0.5 mM iodoacetamide, spin dialyzed, and then immunoprecipitated with 15 over 8 h. (D) Western blot evaluation of the immunoprecipitated fractions from cell lysates treated 15 were positive when developed with antibodies against the IAF tag in L13 and DCD in L14. A 50-kDa band (SI Appendix, Fig. S1) was also positive when stained with an antibody against GAPDH as shown in L15 suggesting that this band contained a fusion between GAPDH, 15, and DCD. L12 depicts a negative control in lysates without probe 15. (E) Western blot analysis depicting the presence of DCD fragments in the immunoprecipitated fraction from HCT-116 cell lysates treated with 16 in L17 at 4 °C over 12 h or lysates from HCT-116 cells that were cultured in media containing 16 in L18, compared with an authentic sample of the full 110 aa DCD protein in L16. (F) qPCR data showing increases in DCD mRNA in HCT-116, PC-3M, and Malme-3M cells treated with 1. The most profound increase in DCD mRNA was found in the most sensitive, Malme-3M cell line, as noted by our need to use reduced (nM) concentrations and the ∼10 fold increase in DCD mRNA expression in Malme-3M cells compared with that observed in HCT-116 and PC-3M cells. Unless noted otherwise, all experiments were conducted in HCT-116 cells and concentrations are provided in µM. Gel lanes are noted by L1-L18, respectively. *P < 0.05.

