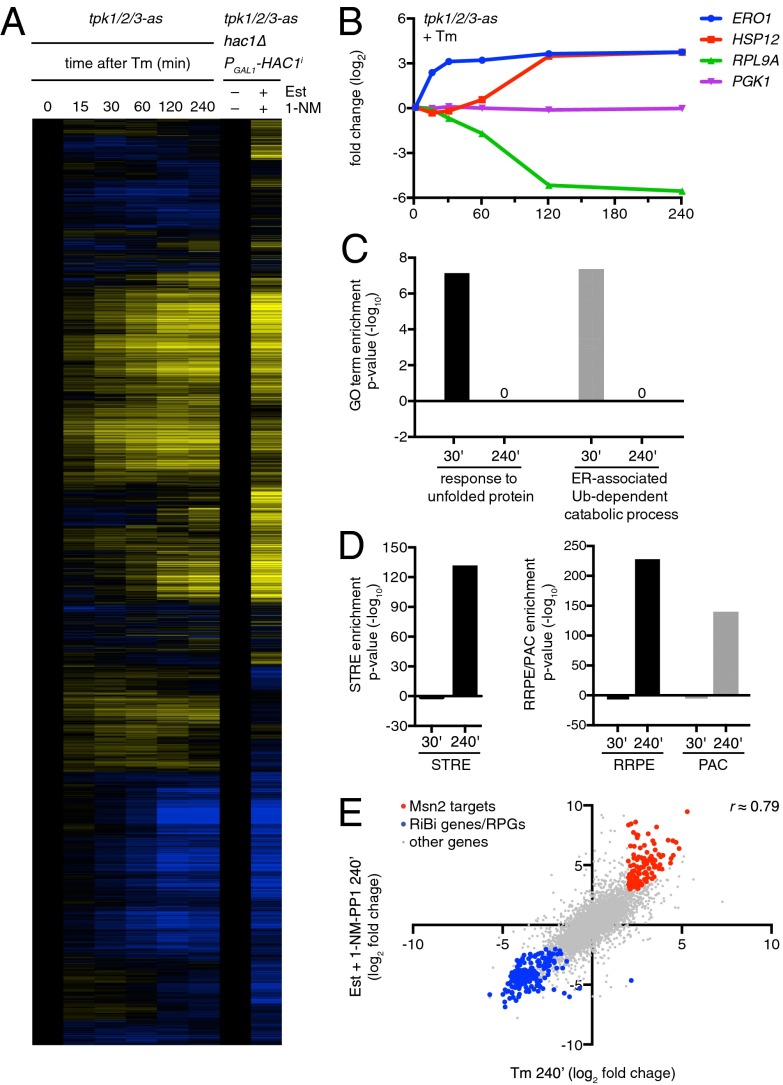
Fig. 4.
Ectopic activation of UPR and deactivation of PKA are sufficient to explain the transcriptional program elicited by tunicamycin. (A) Clustered heat map of the fold change of gene expression upon ER stress (tunicamycin; Tm) or synthetic Hac1 activation/PKA deactivation. Samples were taken at different times after treatment with tunicamycin and at 240 min after estradiol (Est) + 1NM-PP1 addition. (B) Fold change in ERO1, HSP12, RPL9A, and PGK1 expression from cells treated with 5 µg/mL tunicamycin. (C) Enrichment of UPR-related GO terms in the group of genes induced at early times (greater than fourfold at 30 min after tunicamycin treatment) or genes induced only at later times (greater than fourfold at 240 min and less than fourfold at 30 min after tunicamycin treatment). (D) Enrichment of the STRE (Left) and RRPE or PAC (Right) motifs in the group of genes induced at early times or only at later times (as in C). (E) Fold change in gene expression for Hac1 activation/PKA deactivation vs. tunicamycin treatment 240 min after treatment. Msn2/4 targets are highlighted in red. Ribosomal protein and biogenesis genes are highlighted in blue.

