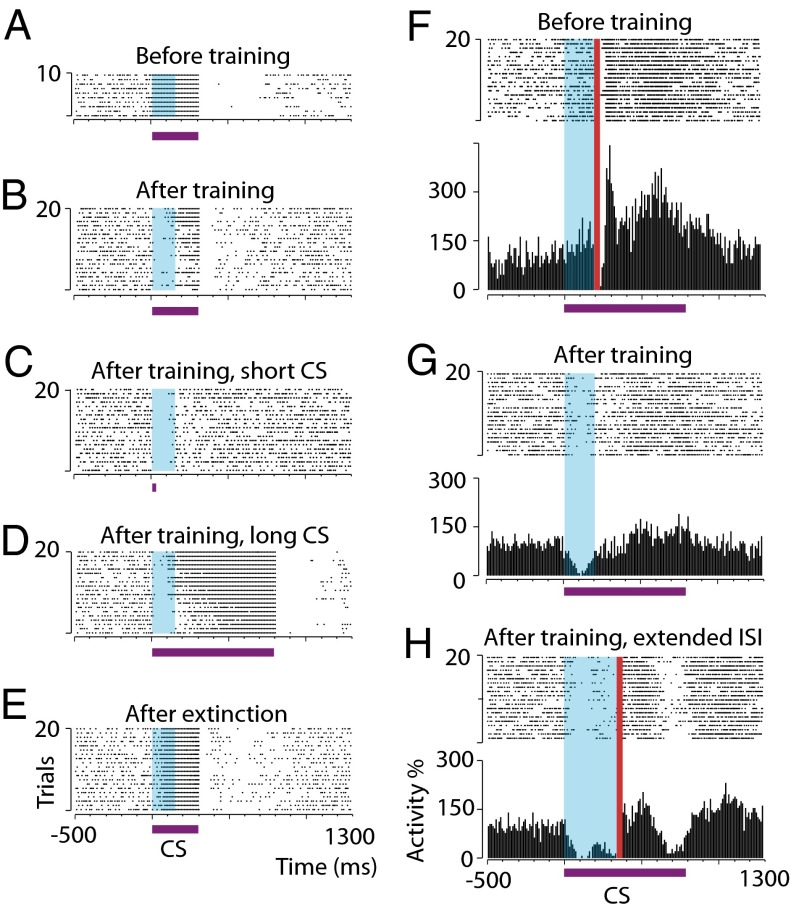
Fig. 2.
Conditioned Purkinje cell responses timed to interstimulus intervals. (A and B) Raster plots showing a typical Purkinje cell response to a 300-ms conditional stimulus before (A) and after (B) training with a 150-ms interstimulus interval (blue shading). (C and D) Responses of the cell in A and B to 17.5-ms (C) and 800-ms (D) conditional stimuli (CS) after training. (E) Response to a 300-ms conditional stimulus after extinction. (F–H) Raster plots and histograms illustrating responses of a Purkinje cell that was trained first with a 200-ms interstimulus interval and subsequently with a 350-ms interstimulus interval. Red vertical bars in F and H denote unconditional stimulus artifacts (data from paired conditional stimulus–unconditional stimulus trials). Purple horizontal bars indicate the conditional stimuli. ISI, interstimulus interval.

