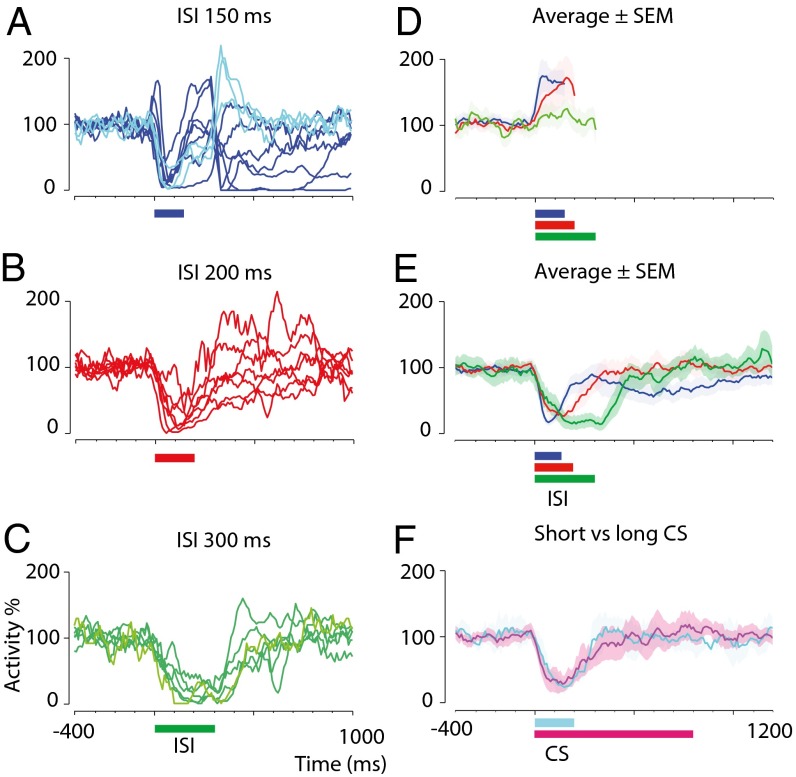
Fig. 3.
Time courses of conditioned responses after training with different interstimulus intervals and using conditional stimuli of different durations. (A–C) Smoothed and averaged simple spike activity after training with 150-ms (blue, n = 10) (A), 200-ms (red, n = 7) (B), and 300-ms (green, n = 6) (C) interstimulus intervals. Traces with lighter shading represent cells for which naive data are lacking. Colored horizontal bars indicate the interstimulus intervals. (D) Activity ± SEM for each interstimulus interval before training. Traces are truncated at the onset of the unconditional stimulus artifact, which prohibits identification of spikes. Abrupt downward inflections at the end of some traces reflect an effect of smoothing (0 identified spikes during the unconditional stimulus artifact). (E) Activity ± SEM for each interstimulus interval after training. (F) Activity ± SEM for cells trained with a 200-ms interstimulus interval and a coterminating conditional stimulus (cyan, n = 2) or an 800-ms conditional stimulus (magenta, n = 5).

