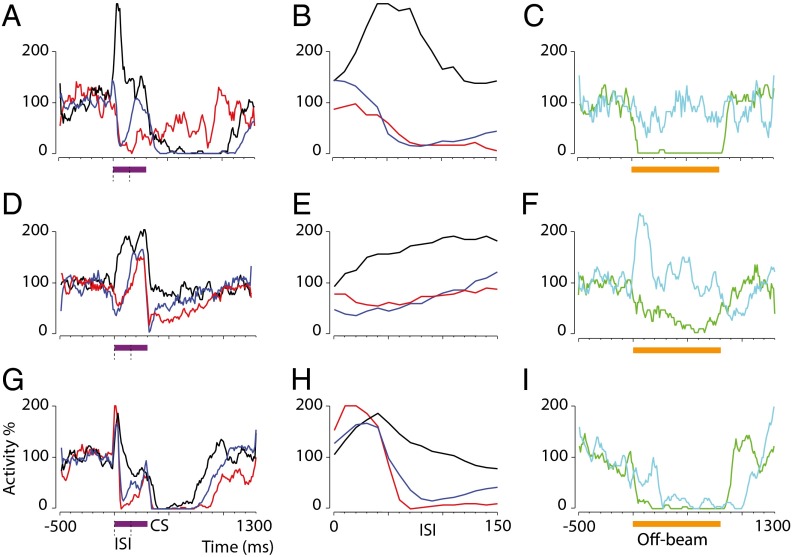
Fig. 6.
Effects of different concentrations of gabazine on conditioned Purkinje cell responses to a parallel fiber conditional stimulus. Each row indicates one cell. (A, D, and G) Naive (black) and conditioned responses before (blue) and after (red) gabazine injection. Purple horizontal bars indicate a 300-ms conditional stimulus. Dashed lines indicate a 150-ms interstimulus interval. (B, E, and H) Magnification of the response during the interstimulus interval. (C, F, and I) Purkinje cell responses to interneuron activation by parallel fiber stimulation before (green) and after (cyan) gabazine injection. At 100 μM, gabazine distinctly blocks inhibition (C and F), whereas 10 μM gabazine blocks inhibition for the first 200 ms (I). Orange horizontal bars indicate off-beam stimulation (800 ms, 81 pulses, 100 Hz).

