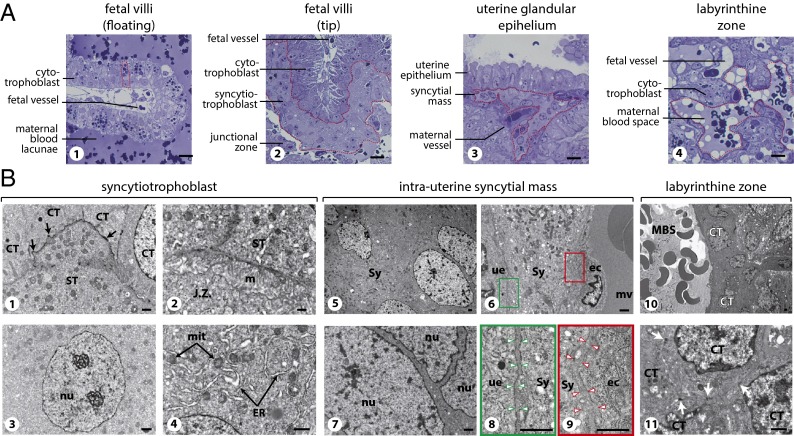
Fig. 7.
Semithin sections (A) and electron microscopy (B) of S. setosus placenta. (A, 1) Semithin sections of a floating fetal villus with hemophagous CTs (one is delineated by a dotted line). (2) The tip of a fetal villus covered by ST (delineated). (3) The maternal glandular epithelium underlaid by an intrauterine syncytial mass (delineated). (4) The labyrinthine zone with CTs separating a large maternal blood space (delineated) from fetal vessels. (Scale bars: 20 µm.) (B) Electron microscopy of the placental structures at midgestation. (1–4) Details of the ST layer. (1) Interface between ST and CTs; tight junctions are indicated by arrowheads. (2) Interface between the ST and the degenerating tissue of the junctional zone (j.z.), with microvilli (m) at the surface of the syncytiotrophoblast. (3) Syncytiotrophoblast nucleus (nu), with two large nucleolar structures and limited heterochromatin. (4) ST cytoplasm with numerous mitochondria (mit) and large endoplasmic reticulum (ER). (5–9) Details of an intrauterine syncytial mass. (5 and 6) Enlarged views of the syncytial mass (Sy) (5), with its cytoplasmic extension located between the maternal uterine glandular epithelium (ue) and the endothelial cells (ec) of a maternal vessel (mv) (6). (7) Higher magnification of the views in 5 demonstrating the absence of a cellular membrane between nuclei (nu). (8 and 9) Higher magnifications of the cells in 6 centered on the interface between the syncytium and the uterine epithelium (8) or the maternal endothelial cell (9). Note the space between the syncytium and the epithelial or the endothelial cellular membranes (indicated by arrowheads), suggesting that the basal membrane of these cells is not degraded by the syncytium at this stage. (10 and 11) Detail of the labyrinthine zone, with a maternal blood space (MBS) delineated by several CTs (10). 11 shows a higher magnification of 10 demonstrating the presence of cellular membranes between the CTs with tight junctions between the cells (white arrows). (Scale bars: 1 µm.)

