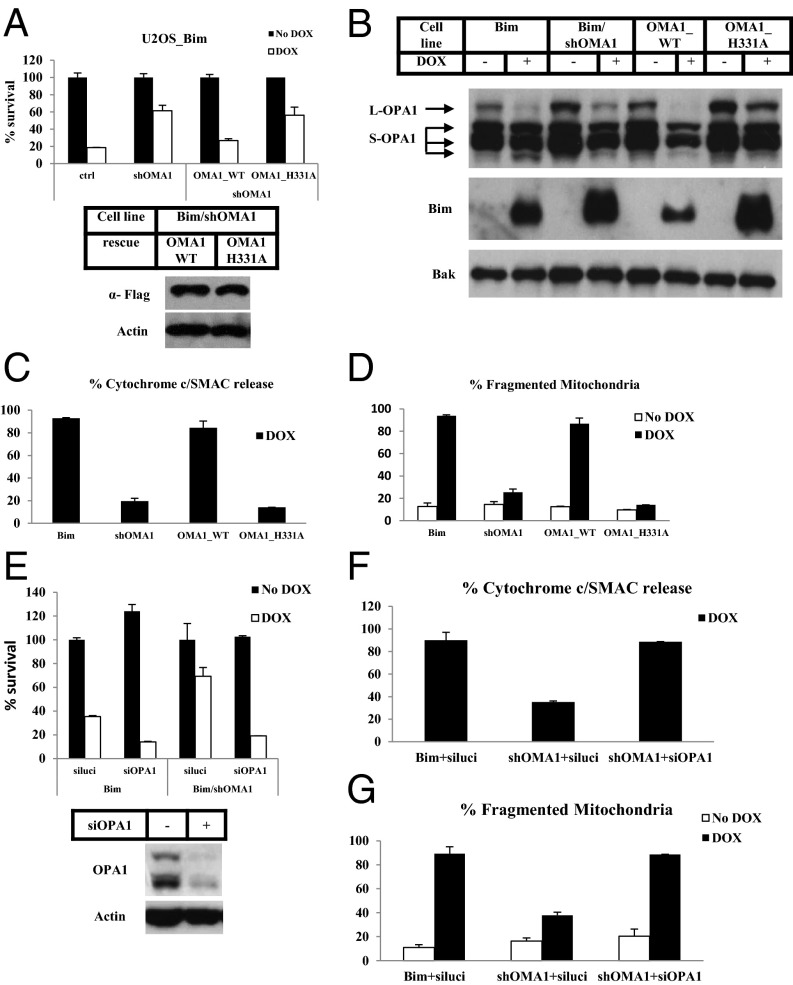
Fig. 4.
OMA1 promotes cytochrome c release through cleavage of OPA1. (A) Bim cells (ctrl), Bim/shOMA1 cells, Bim/shOMA1 cells rescued with wild-type OMA1 (OMA1_WT), and Bim/shOMA1 cells rescued with the protease active site mutant of OMA1 (OMA1_H331A) were treated with or without Dox for 16 h. Cell viability was determined using the Cell-Titer Glo kit. Whole-cell extracts of the indicated cell lines were analyzed by Western blotting. (B) The indicated cell lines were treated with or without Dox for 16 h. The P15 fractions of the cells were analyzed by Western blotting. (C and D) The indicated cell lines were treated with or without Dox for 16 h. z-VAD was included during the treatment for Bim and OMA1_WT cells. Percentages of cells with cytochrome c and Smac release into cytosol (C) or percentages of cells with fragmented mitochondria (D) as examined by immunostaining were calculated. Mitochondria were visualized with immunostaining of TOM20. (E) Bim and Bim/shOMA1 cells were transfected with siRNA against luciferase (luci) or OPA1. Forty-eight hours later, cells were treated with or without Dox for 12 h. Cell viability was determined using the Cell-Titer Glo kit. Whole-cell extracts of Bim cells before and after 48 h of OPA1 siRNA transfection were analyzed by Western blotting. (F and G) Bim and Bim/shOMA1 cells were transfected with the indicated siRNAs and were treated with or without Dox for 8 h. z-VAD was included during the treatment for Bim cells and Bim/shOMA1 cells with OPA1 siRNA transfection. Percentages of cells with cytochrome c and Smac release into cytosol (F) and percentages of cells with fragmented mitochondria (G) as determined by immunostaining were calculated.

