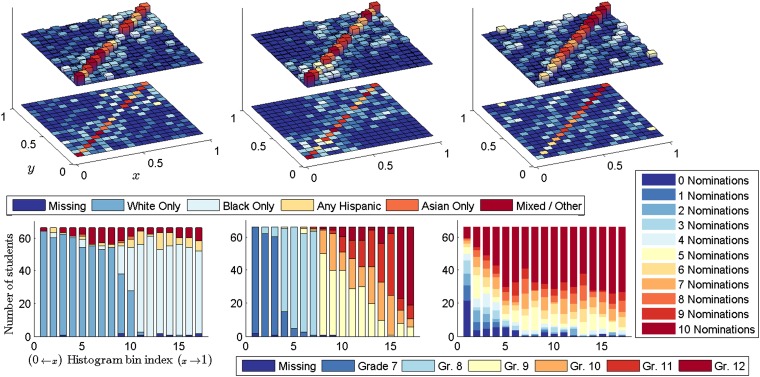
Fig. 4.
Network histogram fitted to student friendship data (Upper), with bins ordered according to mean covariate value for race (Lower Left), school year (Lower Center), and number of friend nominations (Lower Right). The histogram structure visible with respect to each of these three covariates is discussed in the text.

