Fig. 2.
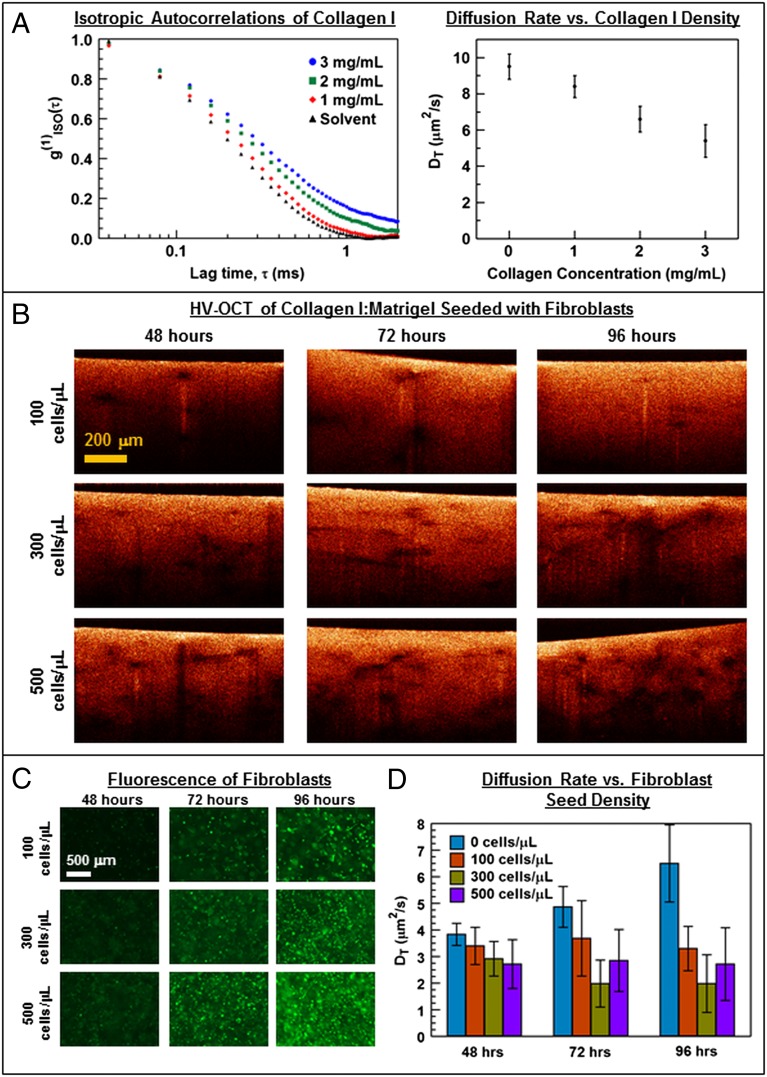
Diffusion of GNRs in in vitro ECM models. (A) Isotropic autocorrelations g(1)ISO(τ) (Left) and corresponding values of DT (Right) are plotted versus collagen I concentration (n = 10, average and SD), revealing how increasing collagen acts to significantly hinder GNR diffusion. (B) Representative B-mode (x–z) HV-OCT images of fibroblasts in collagen I:Matrigel versus cell seed density and incubation time show how GNRs provide positive contrast within the matrix between cells, whereas cells appear dark. (C) Representative fluorescence microscopy of 3D cultures corresponding to B immediately before adding GNRs verifies that the fibroblast density increases with both seed density and incubation time. (D) GNR diffusion (DT) within 3D cultures corresponding to B and C (control n = 12; all other n = 60−156; average and SD). Associated P values (see SI Text for details) are significant for all comparisons between cell densities at each incubation time except for that between 300 and 500 cells per μL at 48 h.

