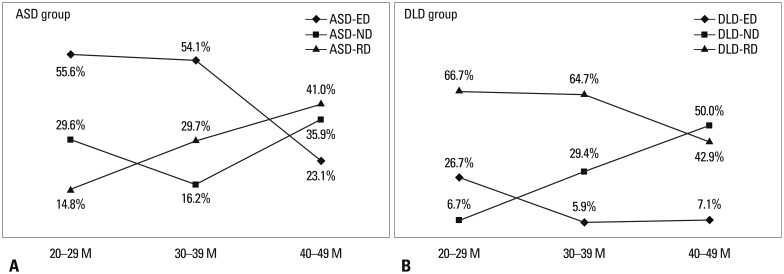
Fig. 2.
Distribution of each dominant type by age group and by diagnosis. (A) Distribution of each dominant type by age group in ASD. In comparison with type by age group chi-square test within ASD group, proportions of dominant types were significant differences between the 20-29 M and 40-49 M age groups and between the 30-39 M and 40-49 M age groups (20-29 M-40-49 M: χ2=8.433, p<0.014, 30-39 M-40-49 M: χ2=8.251, p<0.017). There is no significant difference between 20-29 M and 30-39 M age groups. (B) Distribution of dominant type by age groups in DLD. Using the same analysis method described above, there was significant difference between the 20-29 M and the 40-49 M age groups in DLD (χ2=7.274, p<0.021). In contrast to ASD, there is no significant association in DLD. When compared to inter-group, a significant group difference was identified in the 20-29 M, 30-39 M age group between ASD and DLD (20-29 M: χ2=11.930, p<0.002, 30-39 M: χ2=19.302, p<0.001). ASD, autism spectrum disorder; DLD, developmental language delay; RD, receptive language dominant type; ND, non-dominant type; ED, expressive language dominant type.

