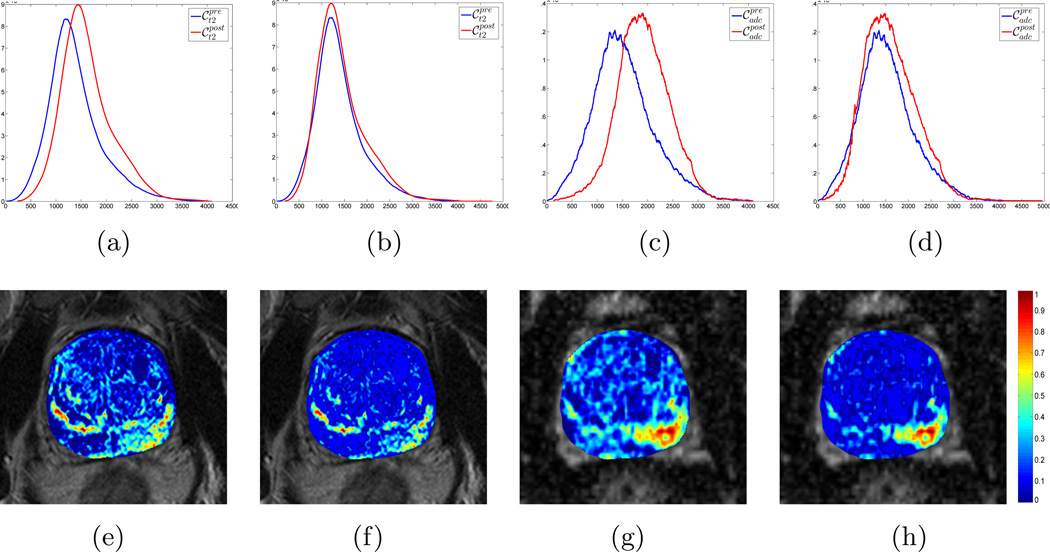
Figure 3.
Visualizing intensity drift between pre- (blue) and post-LITT (red) MR parameters in (a) T2w, and (c) ADC values, by plotting the corresponding distributions along the same axis. Note that after intensity standardization26, both the (b) T2w and (d) ADC distributions are no longer misaligned, implying successful correction of the drift artifact. This enables tissue-specific meaning when comparing MR parameter values between the two acquisitions. This is visualized via difference maps for (f) T2w intensity and (h) ADC values which exhibit markedly few positives outside the ablation zone on the lower right. By comparison, difference maps for (e) T2w intensity and (g) ADC values that have not been corrected for intensity drift exhibit a large number of false positives, implying a non-tissue specific response in imaging features for evaluating LITT-related changes inside and outside the ablation zone.

