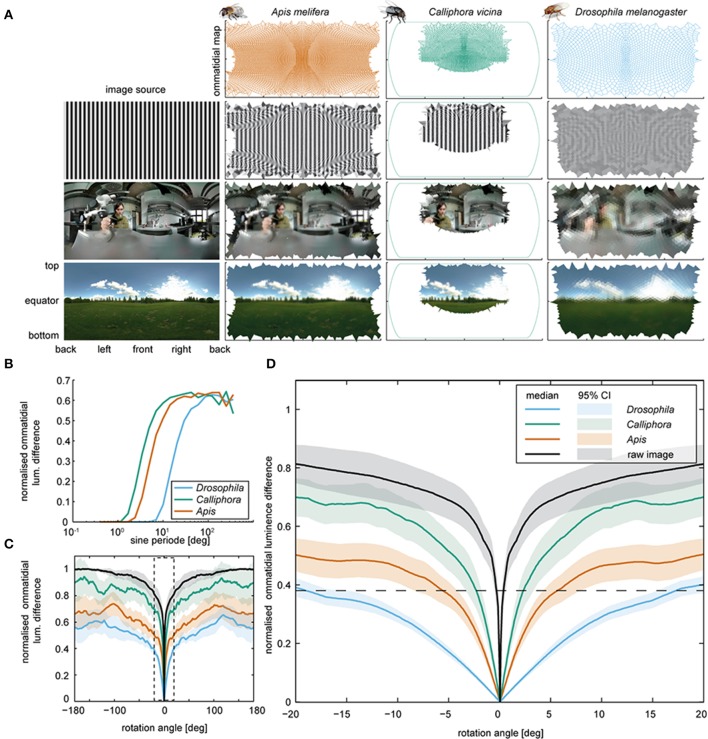
Figure 4.
Retinal inputs and image shifts. (A) Voronoi cells computed for the eyes of Drosophila, Apis, and Calliphora (top row), and respective retinal images (subsequent rows) deduced for three different images (left). The image in the lower row was taken by Janne Voutilainen (for a complete list of the images used, see Supplemental Materials). Note that for Calliphora, only the central field of view is covered (for data sources, see Materials and Methods). (B) Mean ommatidial luminescence difference, caused by shifting sinusoidal stripe patterns with different sine periods by half a sine period. The differences were normalized to the maximal pixel wise difference of the original images and plotted against the sine period. (C) Mean ommatidial luminescence difference caused by shifting images depicting a naturalistic scenes in steps of 0.1° around the animal from −180 to +180° (for images, see Supplementary Figure 1). The differences were normalized to the corresponding pixel wise difference of the image and plotted against the rotation angles. Lines: means; transparent areas: 95% confidence intervals. A zoomed in version of the data in the dashed box is plotted in Figure 4D. For respective data obtained with artificial images with an 1/f spatial distribution, see Supplementary Figure 2). (D) Close-up from panel C. Note that Drosophila generates a smaller ommatidial luminescence difference by turning by more than 15° (as seen during the body saccades) than Calliphora generates by turning about 4° (as seen during a Calliphora head saccade).

