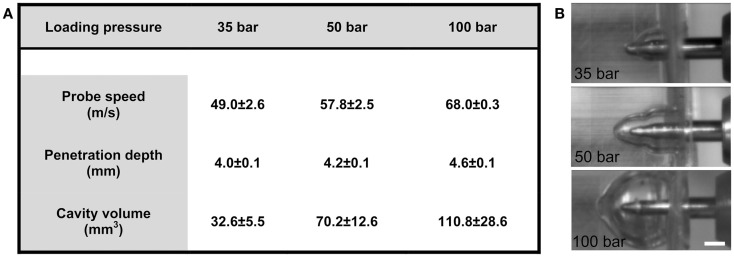
Figure 2.
Technical tests of penetration rig. (A) Table showing the relationship between loading-pressure and maximum speed of probe, depth of penetration, and volume of temporary cavity after indentation in ballistic gel (data presented as mean ± SD, n = 3–5 in each condition). (B) Images from high-speed videos used for quantification of temporary cavity (scale bar = 2 mm).

