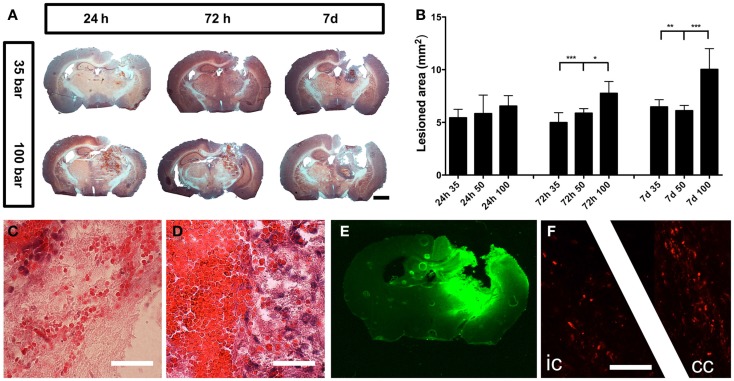
Figure 3.
General pathology. (A) Hematoxylin and eosin staining of mice brains subjected to pTBI with 35 and 100-bar loading-pressure, at different time-points post-injury (scale bar = 2 mm). (B) Graphs of the injured area at 24, 72 h, and 7 days post-injury. Data expressed as mean ± SD (n = 5 in each group). *p < 0.05, **p < 0.01, ***p < 0.001 (ANOVA followed by Bonferroni’s test. (C) Scattered erythrocytes 24 h post-injury. (D) Massive accumulation of erythrocytes, surrounded by macrophage-rich tissue 7 days after injury (scale bar = 25 μm). (E) IgG-staining showing BBB-defects 24 h after pTBI. (F) βAPP-positive axon profiles in the internal capsule “ic” and corpus callosum “cc” 24 h after pTBI (scale bar = 50 μm).

