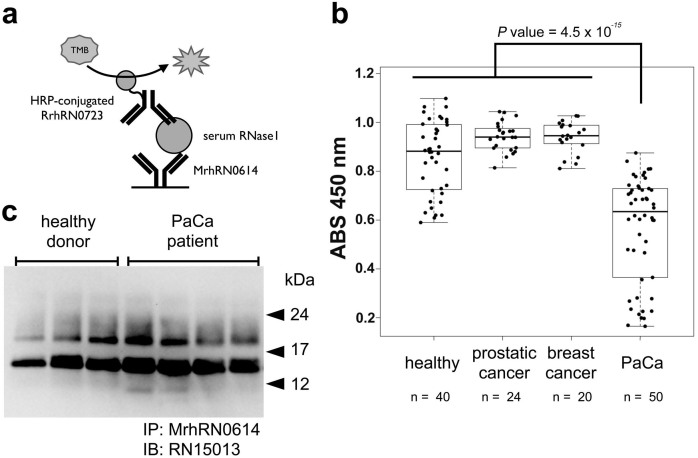
Figure 2. Sandwich ELISA and Western blot analyses of serum RNase1.
A diagrammatic summary of the sandwich ELISA analyses is shown in panel a. MrhRN0614 and HRP-conjugated RrhRN0723 antibodies were used for capture and detection antibodies, respectively. Panel b shows the levels of serum RNase1 in healthy donors and patients with several types of cancer, determined using a sandwich ELISA with MrhRN0614 and RrhRN0723 mAbs. Statistical analysis of serum RNase1 detection of patients with PaCa or other cancers were performed using R statistic software and the P value was calculated using a Wilcoxon-test22,23. The boxes are indicating interquartile ranges for each group of specimens. The length of the error bars are 1.5 fold length of the interquartile range. Panel c shows the results of the Western blot analyses of serum from healthy donors and patients with PaCa patients using the MrhRN0614 antibody to immunoprecipitate RNase1. Multiple bands were detected due to the heterogeneity of N-glycosylation. The result of a single blot membrane was shown in panel c as a cropped image.

