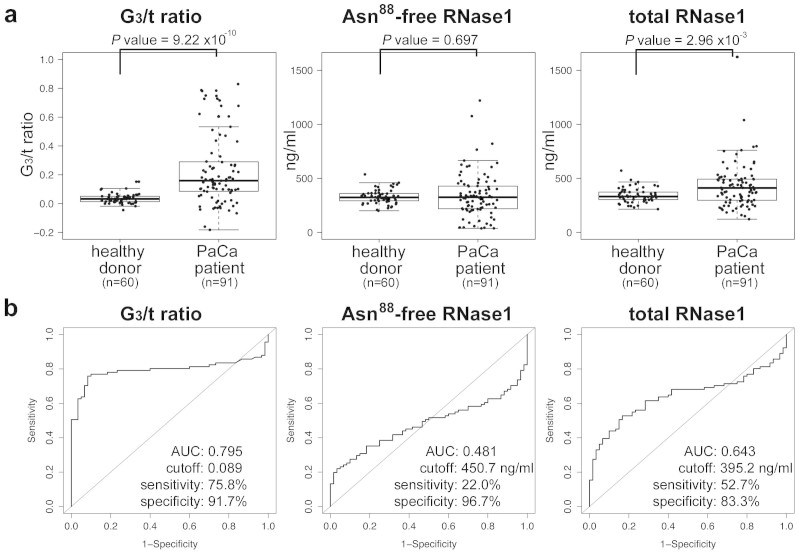
Figure 4. Enzyme Immunoassay and calculated G3/t ratio of serum RNase1 of healthy donors and patients with PaCa.
In panel a, the box-plot overlaid with the scatter plot shows the distributions of G3/t ratio, Asn88-free RNase1 and total RNase1 concentrations in sera of healthy donors (n = 60) and PaCa patients (n = 91). The measurements of Asn88-free RNase1 and total RNase1 concentrations were independently performed twice with duplicate assays. The coefficient of variation (CV) of over 95% assays was within 5%, and the averages of CV were 1.7% and 2.4% for Asn88-free and total RNase1, respectively. The boxes are indicating interquartile ranges for each group of specimens. The length of the error bars are 1.5 fold length of the interquartile range. The values of the median and interquartile range of each analysis are summarized in Table 2. P values of each analysis comparing healthy donors and patients with PaCa were determined using the Wilcoxon-test component of the R statistical software suite. In panel b, the results of Receiver Operating Characteristic analyses using R statistical software with the pROC suite for ROC analysis22,24 are shown for each analysis. The values of area under curve (AUC), cut-off, sensitivity and specificity are shown in each ROC plot. The sample size was confirmed to be appropriate for these comparative analyses with a power of 0.80.

