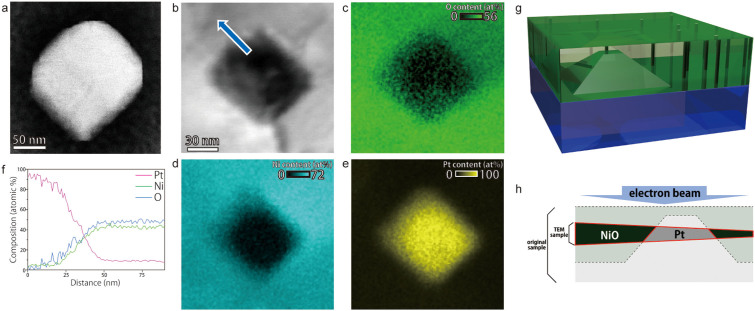
Figure 2. Chemical composition analysis of a square defect.
(a) HAADF-STEM image of a square defect. (b) Bright field STEM image of a square defect where the EDS mapping was carried out. (c) oxygen, (d) nickel and (e) platinum maps obtained by EDS. (f) Line profiles of chemical compositions extracted at the arrows shown in c. (g) A schematic of Pt pyramid in NiO single crystalline film. Upper green region is the NiO film and lower blue block is the single crystalline Pt substrate. Cylinders schematically show dislocations. (h) A schematic of thin foil for TEM and STEM observations with embedded Pt pyramids.

