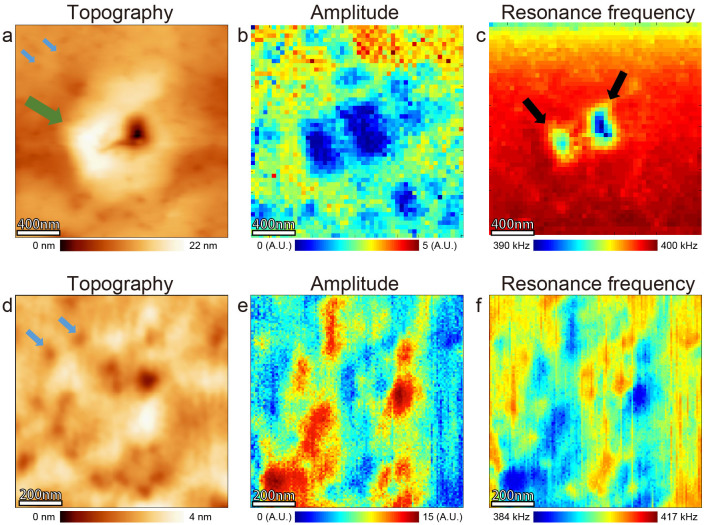
Figure 3. BE-ESM images of the NiO film with various types defects.
BE-ESM images of the region with both dislocations and square hills (a–c) and with dislocations only (d–f). a, d AFM topographic image. b, e Amplitude maps at the resonance frequency. c, f Resonance frequency map. Small (blue) arrows indicate dislocations and large (green) arrows indicate a square defect. The region shown by black arrows are showing reverse relationship between resonance frequency map and amplitude map compared to the other region.

