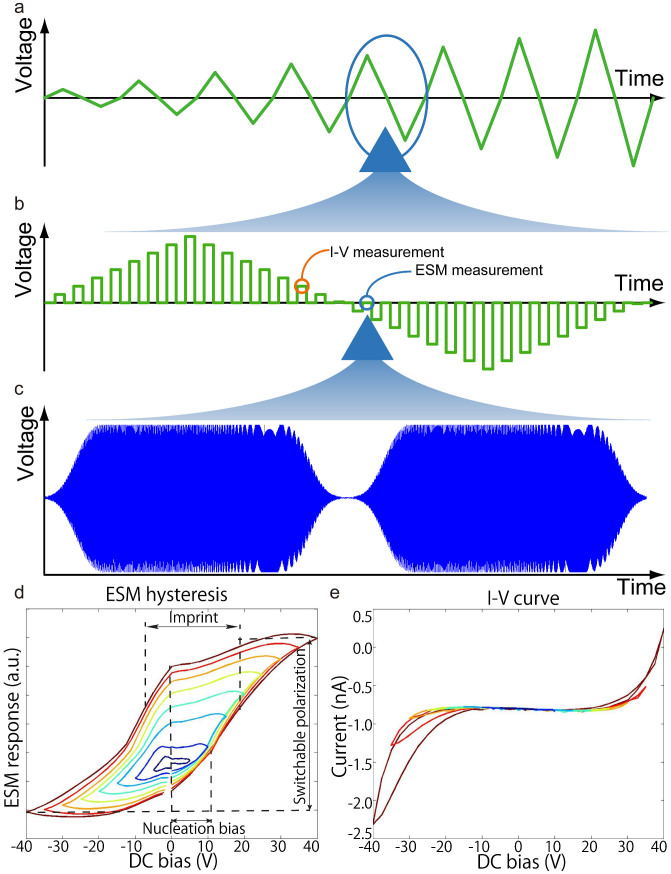
Figure 4. Illustration of the FORC ESM and I-V method.
(a) A schematic of a bipolar FORC waveform. (b) A schematic of one triangular wave in the FORC measurements. Triangular waves were formed by a set of pulses, and ESM measurements were carried out in the pulse-off state, whereas I-V measurements were carried out in thepulse-on state. (c) A schematic of two consecutive BE waveforms. A selected number of sinusoidal waves with frequencies within a band centered on the resonance frequency are combined to construct the band excitation waveform. (d) Typical ESM hysteresis loops obtained by averaging the ESM responses for all 50 × 50 measured points in Fig. 5. Various parameters mapped in Fig. 5 are defined here. (e) Typical I-V hysteresis loops obtained by averaging the ESM responses for all 50 × 50 measured points in Fig. 5.

