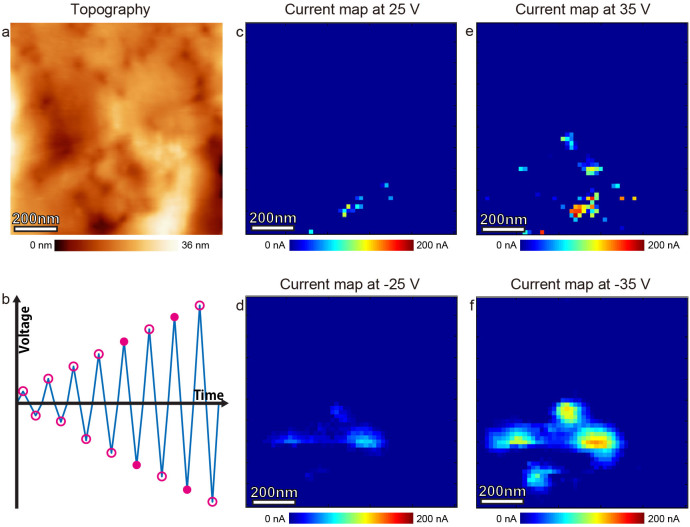
Figure 6. Current conductivity maps at selected peak biases.
Current maps recorded simultaneously with FORC ESM shown in Fig. 5. (a) Topographic image of the measured region. (b) A schematic of the applied voltage waveform envelope. Current maps in (c–f) are obtained at the peak biases highlighted by filled circles. Current maps at the peak biases highlighted by open circles are not shown here. Current maps peak biases are: (c) 25 V, (d) −25 V, (e) 35 V, (f) −35 V.

