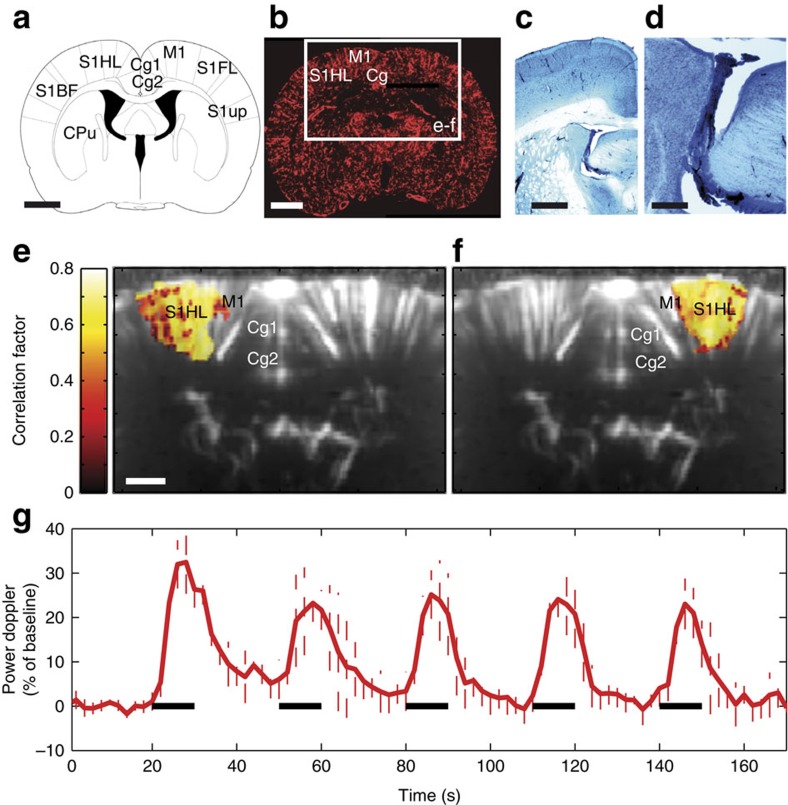
Figure 1. Functional identification of putatively interconnected seed regions using task-evoked haemodynamic changes.
Anatomical organization of the rat brain at Bregma −0.6 mm (a) and mapping of the cerebral blood vessels at the same level using either staining with DiI (b) or India ink (c,d). (c,d) Black staining: India ink; blue counter staining: toluidine blue. Between the two techniques for vasculature staining, DiI is more sensitive. However, India ink more clearly shows the typical curved vascular staining observed in the choroid plexus, which is prominently displayed in the fUS image. (d) High-power magnification of c. Functional ultrasound (fUS) imaging evoked in the left (e) or right (f) somatosensory cortex, hindlimb part (S1HL) using electrical stimulation (5 Hz, 0.2 mA, 100 μs width for 10 s, separated by 20 s) of the right (e) or left (f) sciatic nerve applied either on the right (e) or left (f) side, respectively. (g) Time course changes in the evoked fUS response in the left S1HL following stimulation of the contralateral sciatic nerve. Black bar: duration of the stimulation. Electrical stimulation of the left hindpaw induced a reproducibly increased fUS signal in the contralateral (right) S1HL. Scale bars, 2.3 mm (a,b), 1.5 mm (c), 375 μm (d), 1 mm (c–f).

