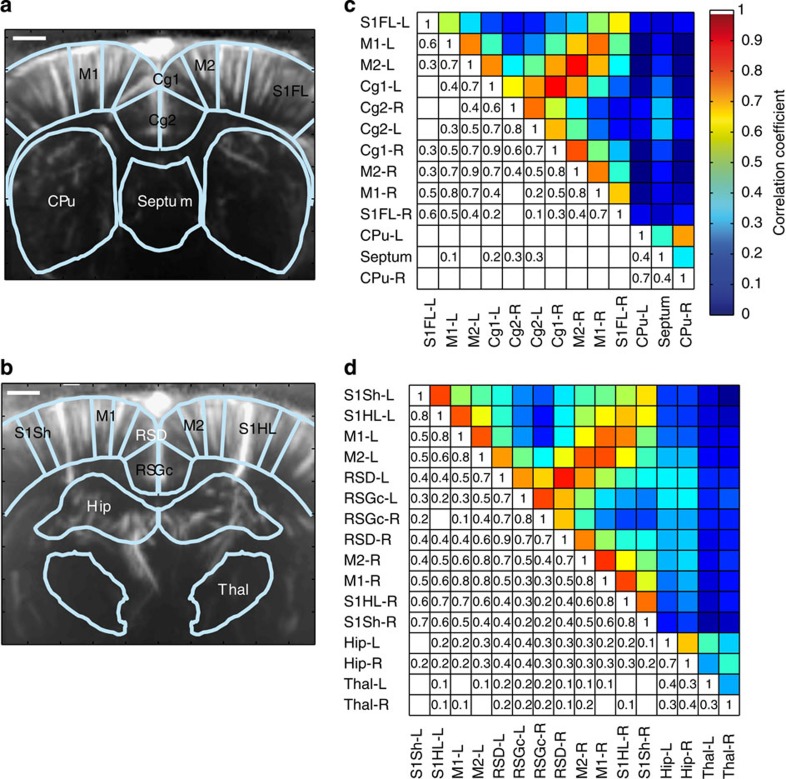
Figure 5. Correlation matrices of the functional connectivity.
(a,c) Matrices at Bregma +0.84 mm and (b,d) matrices at Bregma −2.16 mm. (c,d) The correlation matrices obtained show a strong bilateral correlation of signals in the cingular, retrosplenial granular, motor and S1 cortices, as well as between the motor and S1 cortices. Other brain areas, such as the caudate putamen, septum, hippocampus and thalamus showed bilateral correlations and weak-to-no correlation with the somatomotor areas. Scale bar, 1.1mm.

