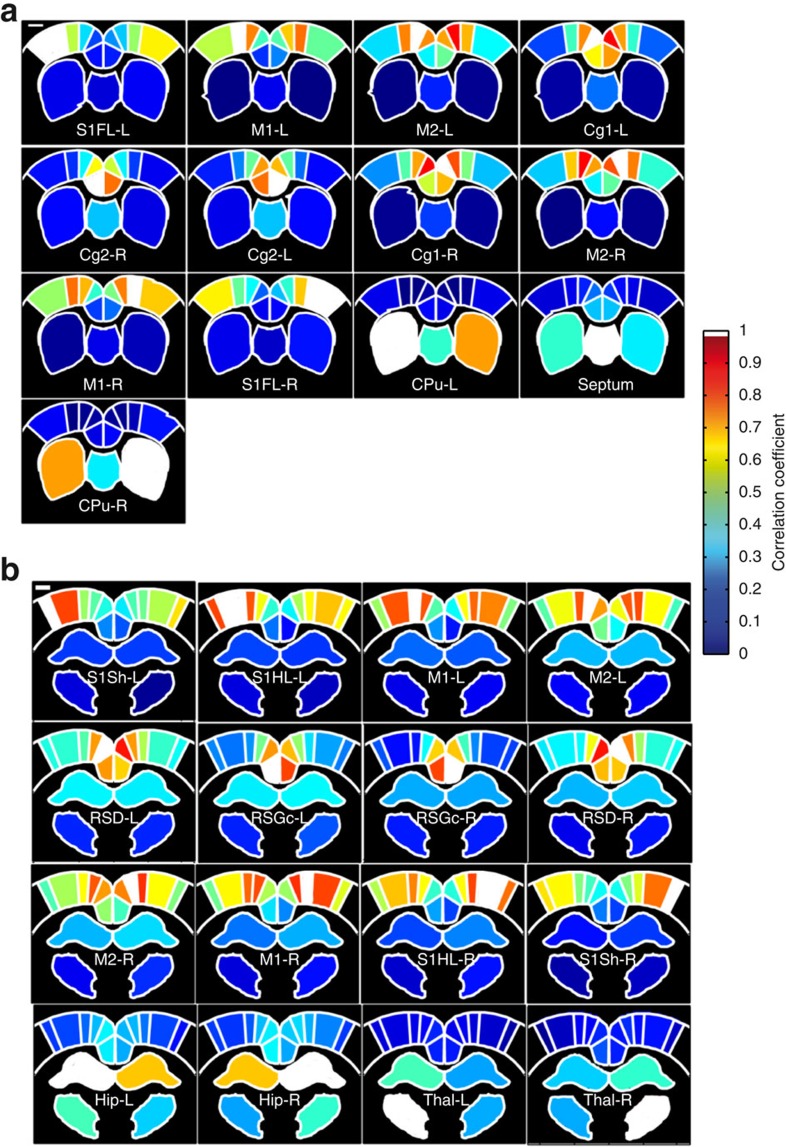
Figure 6. Spatial representation of temporally correlated fUS signals.
Correlation coefficients of the temporally correlated fUS signals measured at Bregma +0.84 mm (a) and Bregma −2.16 mm (b), and presented in correlation matrices on Fig. 5, with the seed region indicated in white. Scale bar, 1mm.

