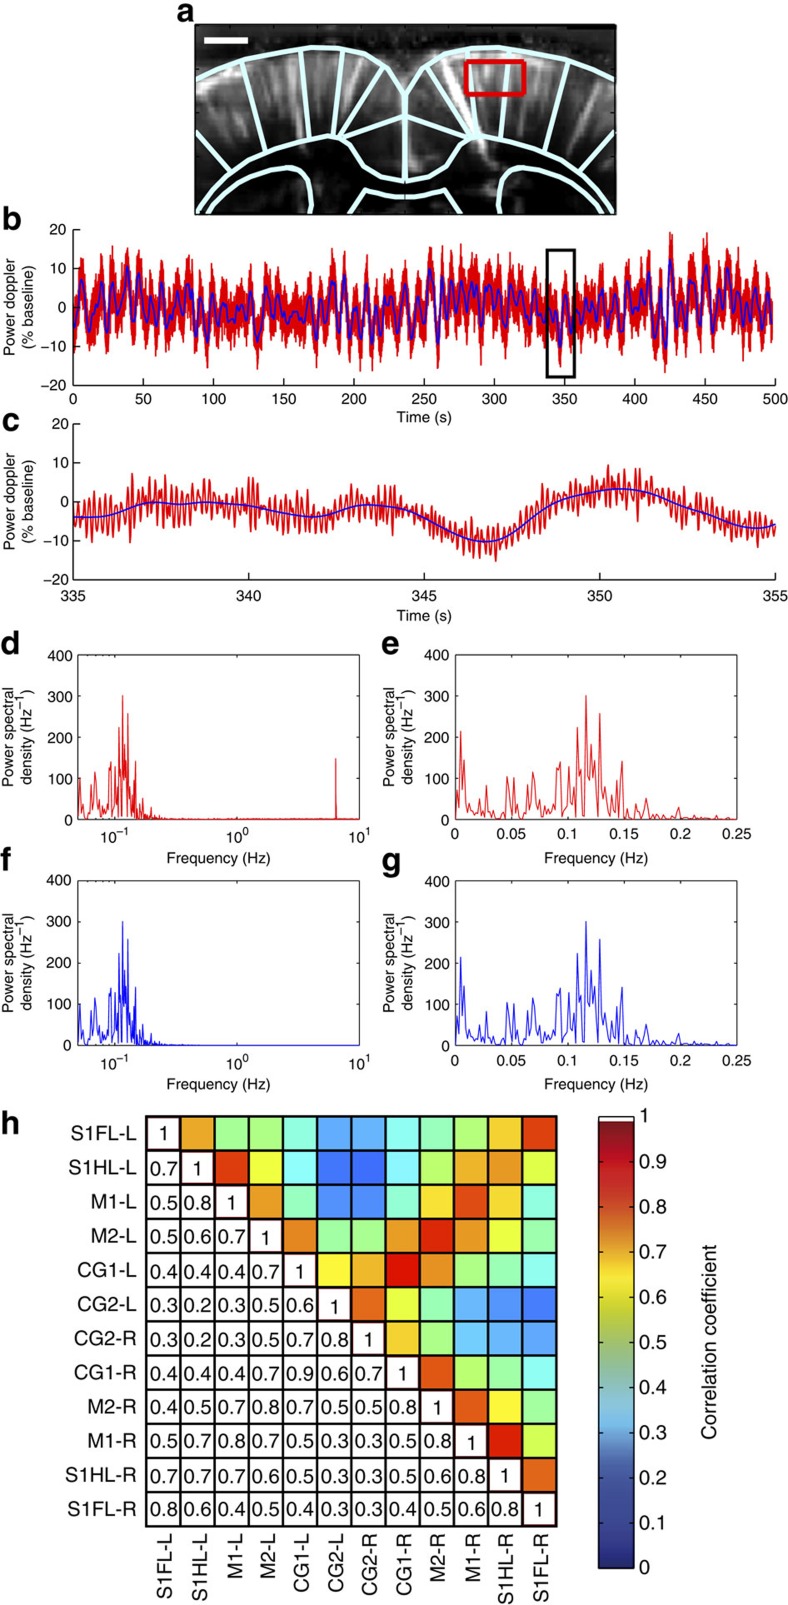
Figure 7. High-frequency physiological noise can be completely removed from the spontaneous fUS signal.
(a) The area boxed in red on the vascular map was analysed using the continuous high frame rate fUS sequence number 2. Scale bar, 1 mm. (b) fUS signals obtained from the area labelled on a, with (blue) and without (red) low-pass (butter third order, 0.5 Hz frequency cutoff) filtering of cardiac pulsatility. (c) Expansion of the area boxed in b reveals oscillations resulting from cardiac pulsatility (red), superimposed on low-frequency spontaneous variations of the fUS signal (blue). (d) Power spectral density of the raw signal obtained from the area labelled in a before cardiac pulsatility filtering (semilog scale). The low-frequency peak (~0.1 Hz), zoomed in e (linear scale), represents the functional connectivity signal. The high-frequency peak (~7 Hz) is the biological noise due to the cardiac pulsatility. (f,g) Power spectral density of the signal obtained from the area labelled in a after cardiac pulsatility filtering. The low-frequency components of the functional connectivity (g) are not disturbed by the filtering. (b–g) Representative results obtained from one animal. (h) Mean functional connectivity matrix of dorsal cortical regions at Bregma +0.8 mm obtained with the continuous high frame rate fUS sequence number 2 followed by pulsatility filtering (in N=5 animals). This matrix is highly similar to the connectivity matrix obtained using the intermittent frame rate, low-bandwidth sampling sequence number 1, shown previously in Fig. 4a. The mean Pearson correlation coefficient of the FC matrix intercorrelation coefficient, using only the non-diagonal values, was 0.80±0.05, P<0.001, n=5.

