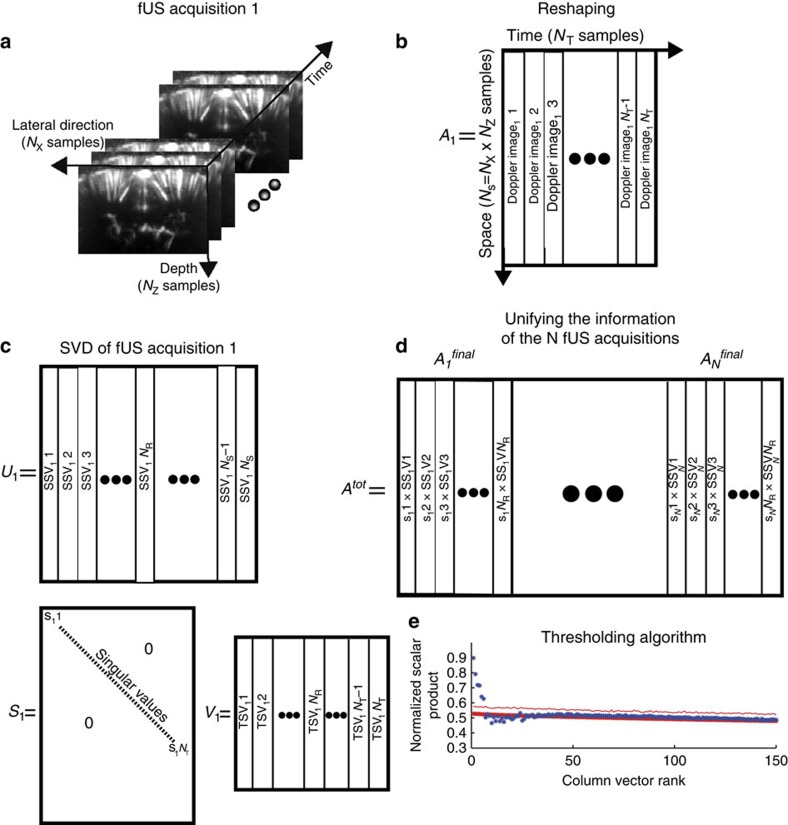
Figure 8. Singular value decomposition processing.
(a) Description of the fUS acquisition as a three-dimensional matrix. (b) Reshaping the fUS three-dimensional acquisition matrix into a two-dimensional matrix for singular value decomposition. (c) Result of the singular value decomposition of a fUS matrix. (d) Combination of the information from the N fUS acquisitions. (e) Results from the thresholding. Blue dots: values of the GSMs with the noise removed. Red dots: simulated Gaussian random noise. Plain line: 2 × the s.d. of mean noise. The GSMs with a value higher than this level were considered significantly different from noise.

