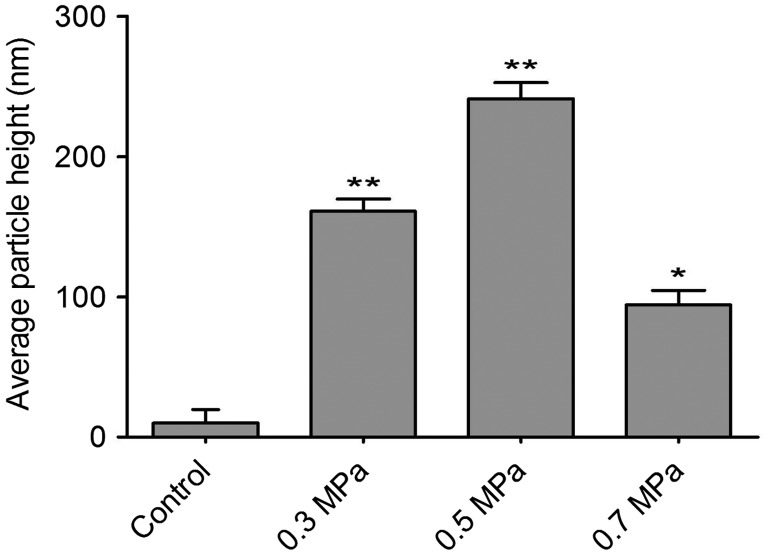
Fig. 3.
Quantification of cell-surface granules ascertained from AFM images for various cell samples as indicated in Fig. 2.
Notes: The bar graph represents the mean height (±SEM) of particles in each condition. Samples with mechanical compression value in 0.3, 0.5, and 0.7 MPa group have a significant higher average particle size than their untreated controls (*p < 0.01, **p < 0.001).

