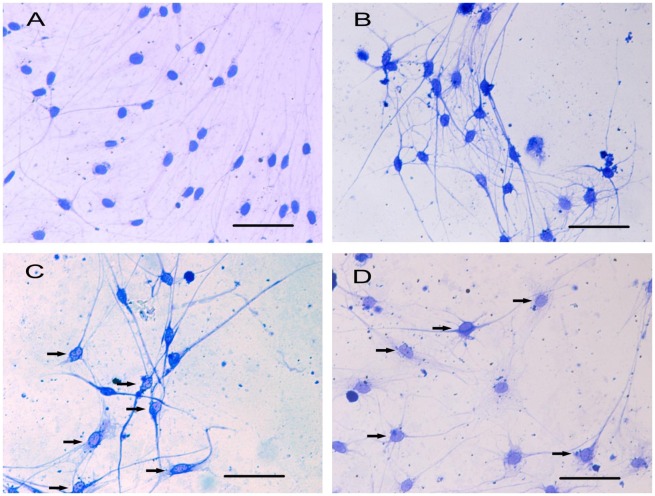
Fig. 4.
CBB staining shows different distribution of cytoskeleton in cultured DRG neurons.
Notes: The distribution of cytoskeleton is nearly normal and there are no significant marginalized gathered cytoskeleton in DRG neurons in control group (A) and 0.3 MPa group (B). However, in 0.5 MPa group (C) and 0.7 MPa group (D), the distribution of cytoskeleton changed obviously, with some nonuniformed distribution of cytoskeleton. Black arrows show the marginalized gathered cytoskeleton in mechanical-treated cells. Scale bar, 50 μm.

