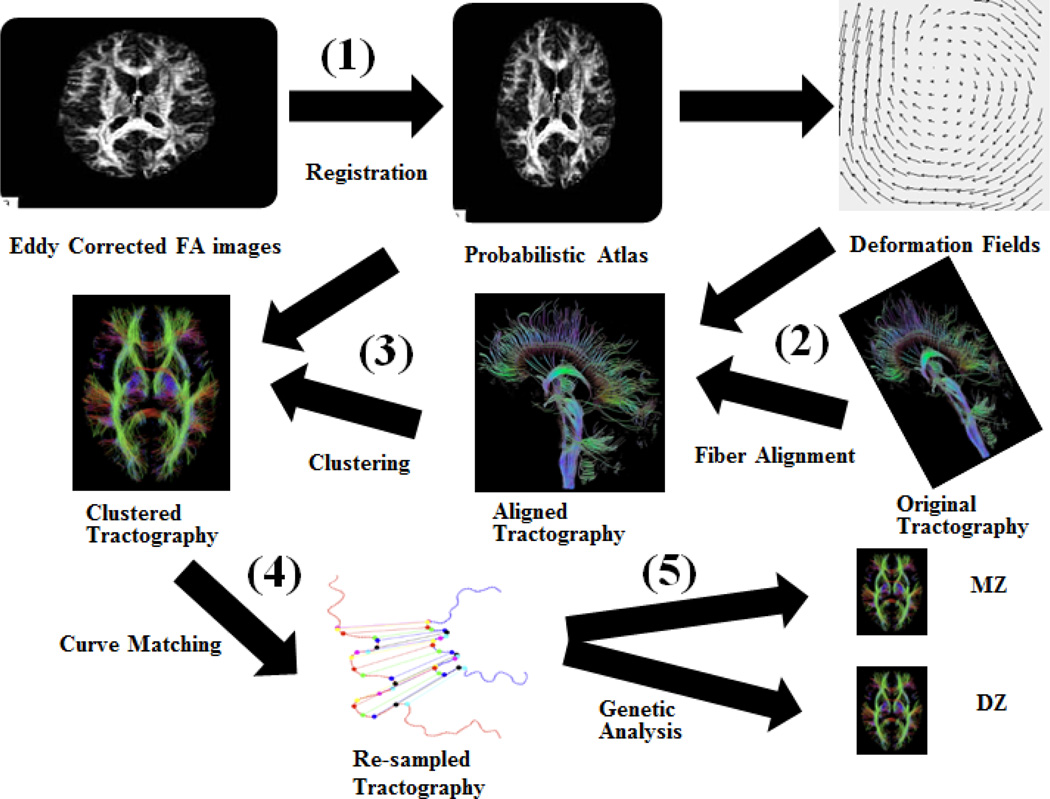
Fig. 1.
Flow chart of the image processing steps: (1) Each subject’s FA image was nonlinearly registered to the atlas. (2) The resulting deformation fields were applied to the extracted fibers to warp them into the atlas space. (3) Fibers were clustered based on their locations in the atlas. (4) With shaped-based curve matching, we interpolated the points on the fibers corresponding to those on the mean curve of the tract. (5) Genetic analysis was performed on the defined shape metrics.

