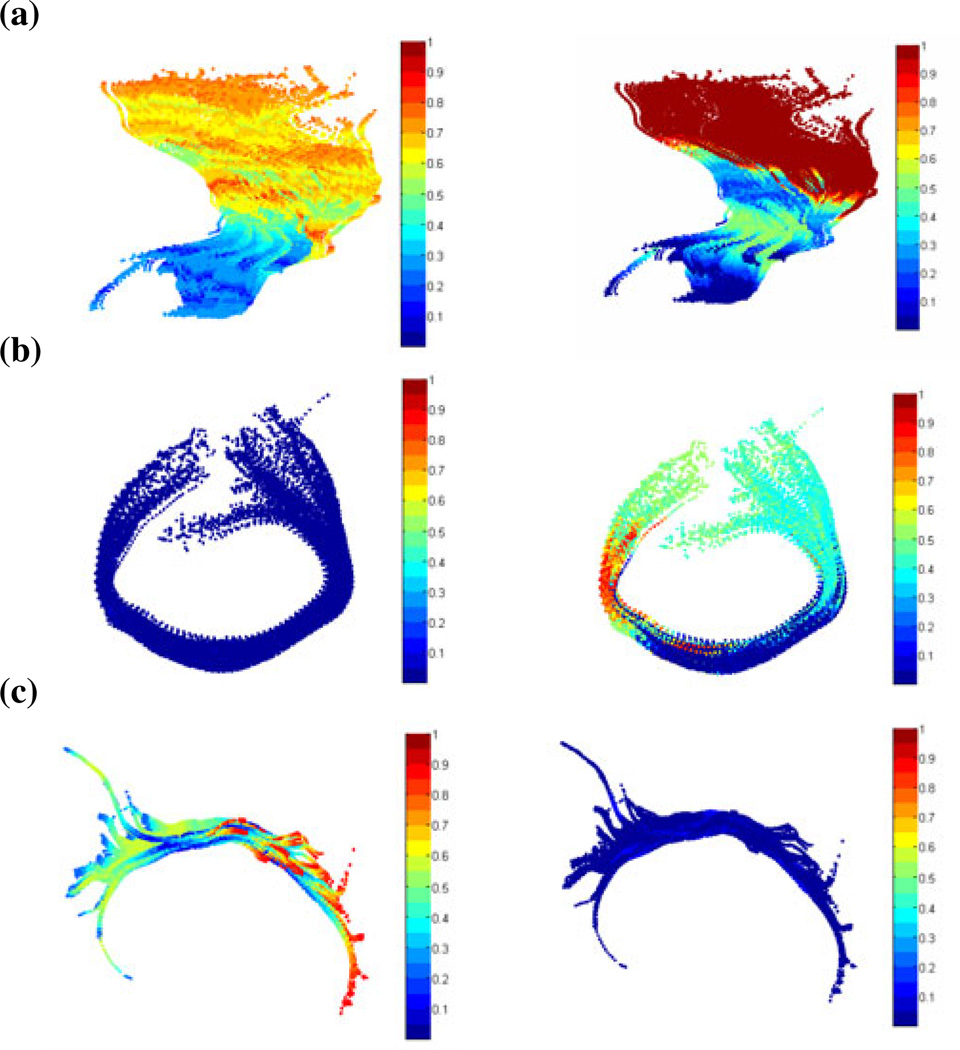
Fig. 4.
Color maps show Falconer’s heritability statistic for (a) the mean distances (left) and the standard deviations of distances (right) of the left corticospinal tract; (b) the mean distances (left) and the standard deviations of distances (right) of the tract that runs through the callosal genu; (c) the mean distances (left) and the standard deviations of distances (right) of the left cingulum tract.

