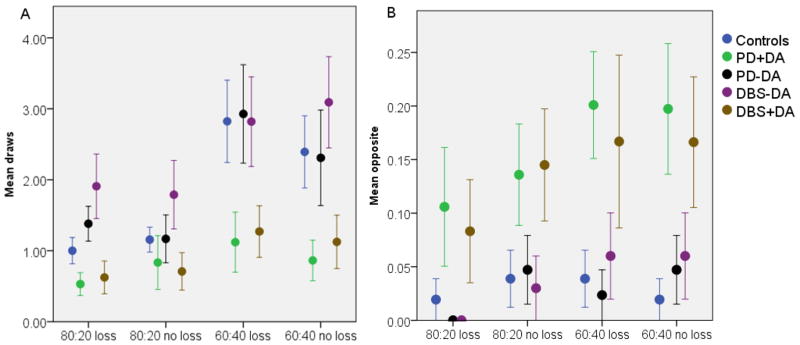
Figure 1.

Figure 1A: Average drawing behaviour per condition of different groups (left). One bead is always shown before the participant must make a decision, so total beads seen are mean draws plus one. 1B: Number of times participants chose the opposite colour (right).
