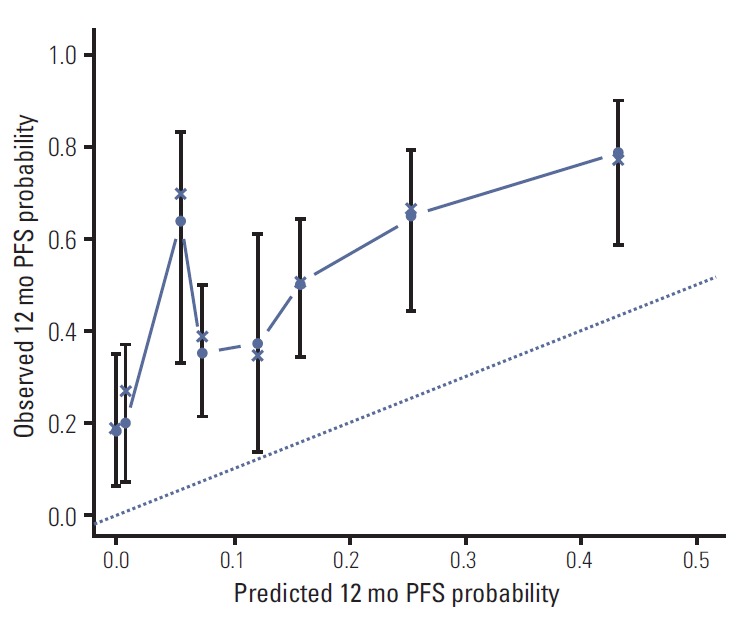
Fig. 3.

Calibration plot for 12-month progression-free survival (PFS) from the nomogram. On the calibration plot, the x-axis is nomogram predicted probability of PFS. The y-axis is observed PFS. Vertical bars indicate 95% confidence interval calculated using Kaplan-Meier analysis.
