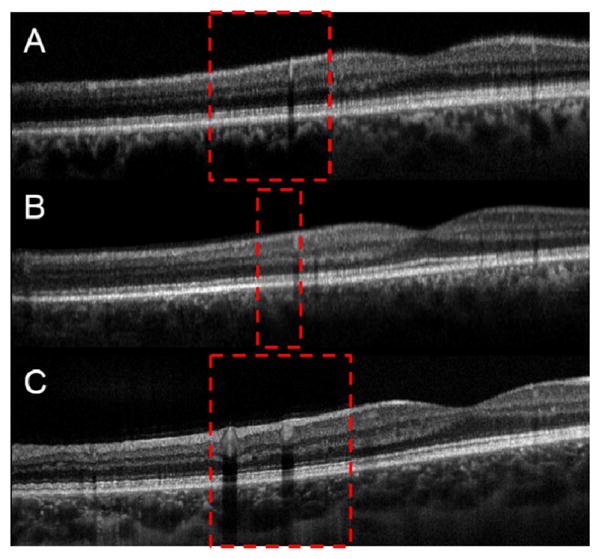
Fig. 4.

Images from two different healthy volunteers. The red dashed box shows the overlap between the two images. A is a single frame buffered dual spot image acquired with an effective A-scan rate of 400 kHz. B is a single unbuffered denoised frame. C is the result of rigid body registration and averaging of 20 individual unbuffered frames. A and B are from the same volunteer, and C is from a different volunteer.
