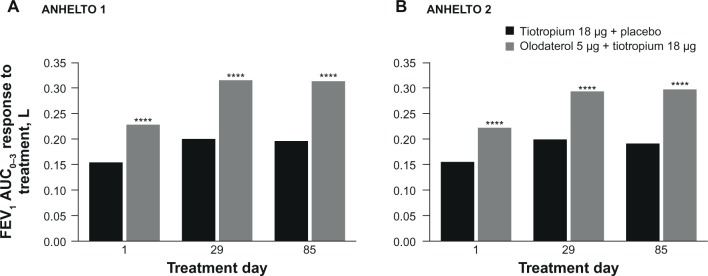
Figure 4.

FEV1 AUC0–3 response to treatment in (A) ANHELTO 1; (B) ANHELTO 2.
Notes: ****P<0.0001 (olodaterol + tiotropium versus tiotropium + placebo); n=1,132 (ANHELTO 1), n=1,135 (ANHELTO 2).
Abbreviation: FEV1 AUC0–3, area under the curve from 0–3 hours of forced expiratory volume in 1 second.
