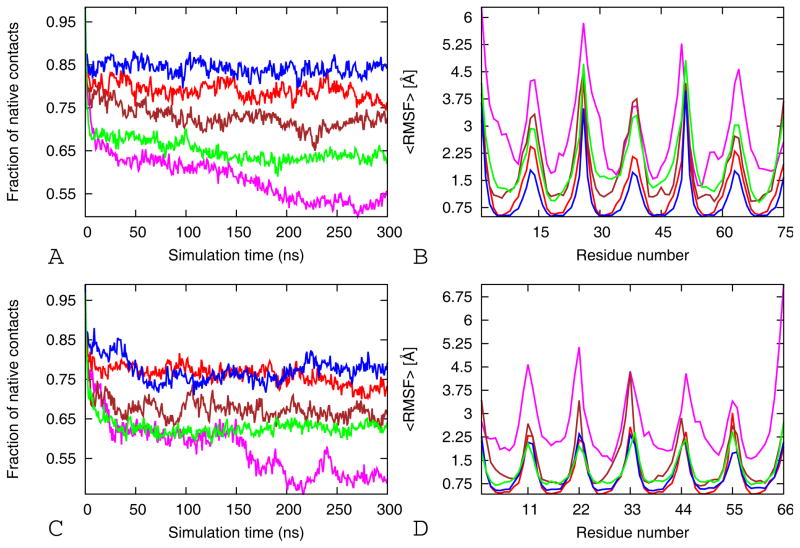
Figure 3.
The fraction of native contacts and average backbone RMS fluctuations (RMSF) per residue as function of time. The average fraction of native contacts (A) and the average RMSF (B) of the tandem repeat cylindrin simulations. Red for wild-type (WT-TR), magenta for V4GV8G-TR, brown for V4AV8A-TR, blue V2L-TR, and green for VTL-TR. The average fraction of native contacts (C) and the average RMSF (D) of the single chain cylindrin simulations. Red for wild-type (WT), magenta for V4GV8G, brown for V4AV8A, blue V2L-TR, and green for VTL. The results are calculated by using the three 300 ns trajectories for each model.

