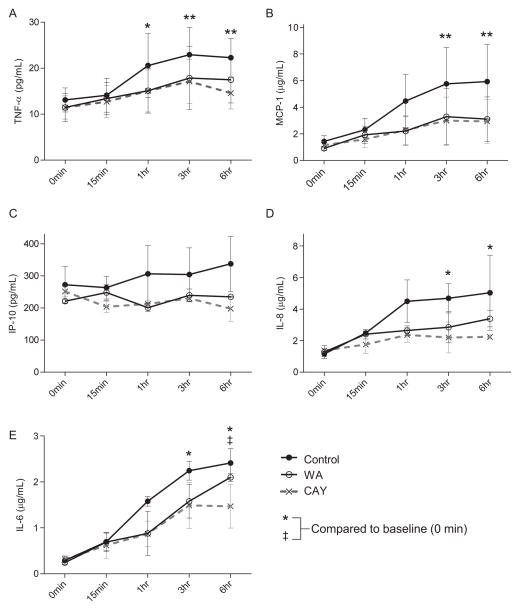
FIGURE 3.
Inhibition of proinflammatory cytokine secretion by NFκB inhibitors. The plasma levels of TNF-α (A), MCP-1 (B), IP-10 (C), IL-8 (D), and IL-6 (E) are shown. Solid line (black circle), solid line (open circle), and dotted lines show control, withaferin A (WA), and CAY10512 (CAY) groups, respectively. Symbols indicate the P value compared to baseline within each group of control* or WA‡ and the significance levels: *P<0.05 and **<0.01. Data express average ± SE based on 3 independent experiments. Repeated-measurement two-way ANOVA with Dunnett’s multiple comparison test was performed for statistical evaluation.

