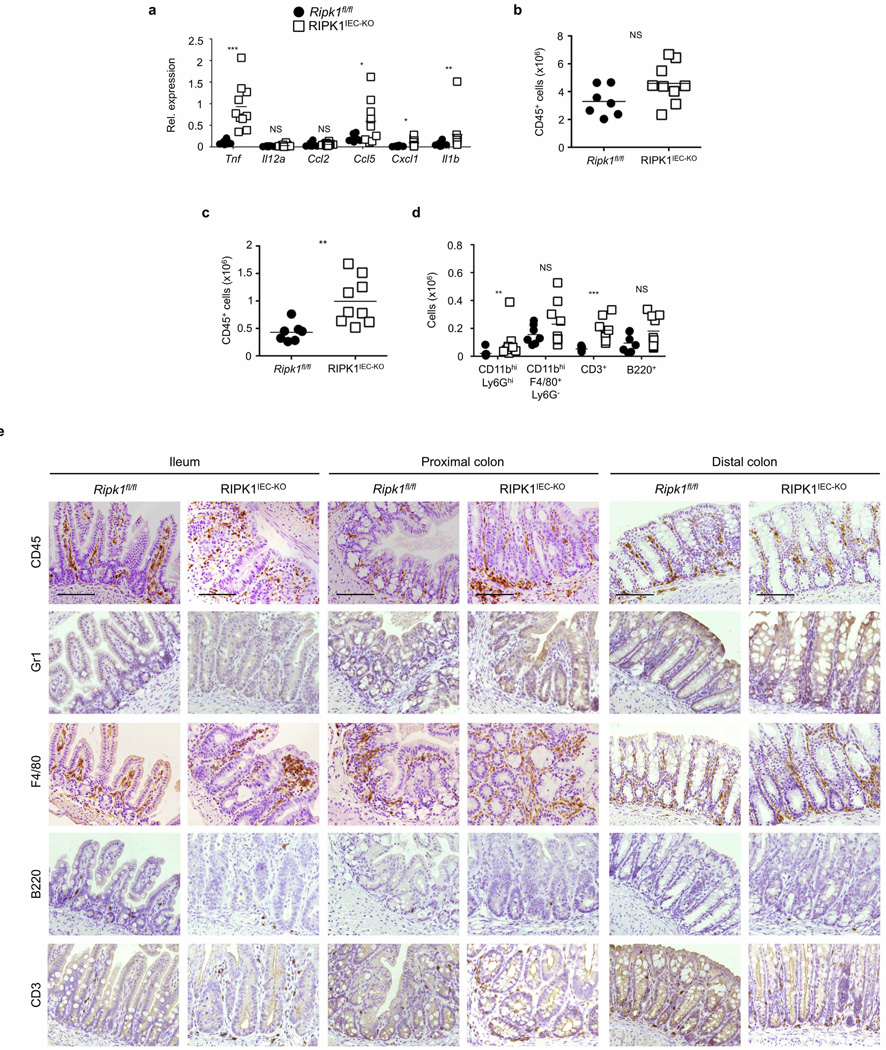
Extended Data Figure 2. Mild intestinal inflammation in RIPK1IEC-KO mice.
a, qRT–PCR analysis of cytokine and chemokine expression in colon tissue from Ripk1fl/fl and RIPK1IEC-KO mice. b–d, FACS analysis of lamina propria leukocytes in the small intestine (b) and colon (c, d) of Ripk1fl/fl and RIPK1IEC-KO mice. e, Representative images from intestinal sections from Ripk1fl/fl and RIPK1IEC-KO mice immunostained with the indicated antibodies. Scale bars, 100 µm. *P ≤ 0.05, **P ≤ 0.01, ***P ≤ 0.005; NS, not significant.

