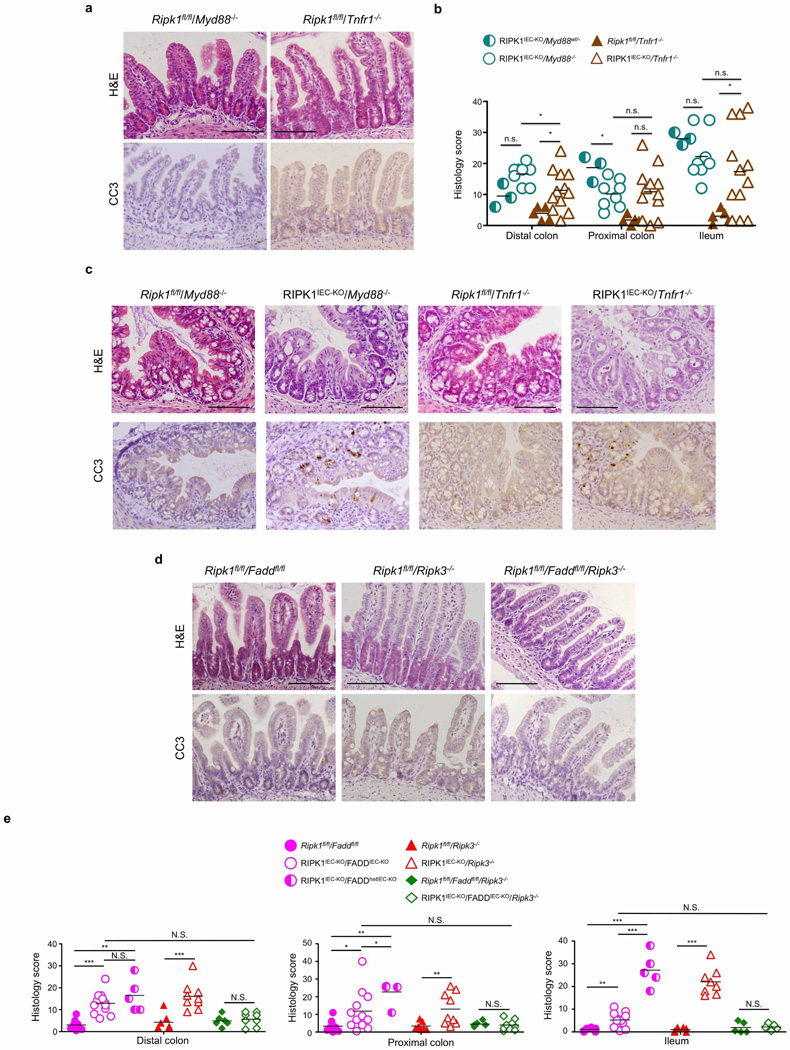
Extended Data Figure 5. Role of MyD88, TNFR1, FADD and RIPK3 in the intestinal pathology of RIPK1IEC-KO mice.
a, Representative images of ileal sections from the indicated mice as controls for the mice shown in Fig. 2a. b, Quantification of histological pathology score of the indicated mice. c, Representative images of H&E- or CC3-stained colon sections from the indicated mice. d, Representative images of H&E- or CC3-stained ileal sections from the indicated mice. Scale bars, 100 µm. e, Quantification of histological pathology score of the indicated mice. *P ≤ 0.05, **P ≤ 0.01, ***P ≤ 0.005; NS, not significant.

