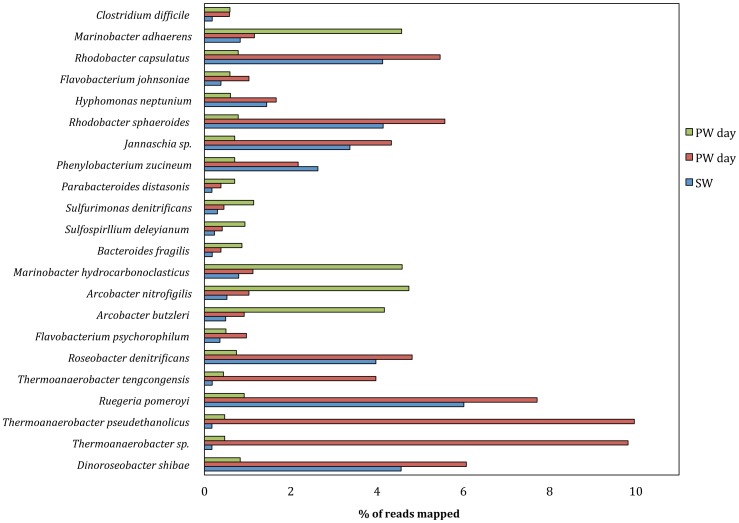
Figure 4. Read distribution for source water (SW), produced water day 1 (PW day 1) and produced water day 9 (PW day 9) samples.
Reads were mapped against reference genomes using CLC Genomic workbench version 6.5.1 using default parameters. Shown are percentages of reads mapped against each reference genome included in the analysis for all three samples.

