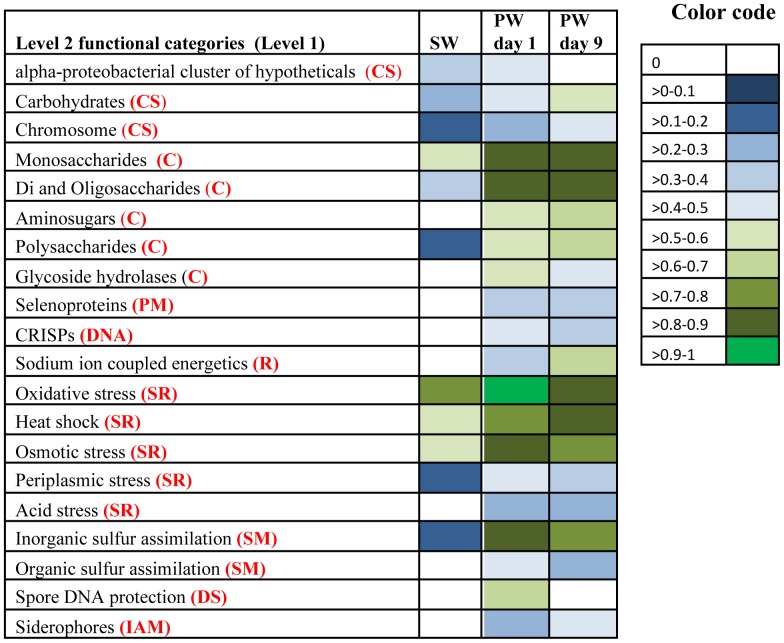
Figure 7. Normalized abundance (values of 0–1) of contigs belonging to selected Level 2 functional categories within associated Level 1 categories in source water (SW), produced water day 1 (PW day 1) and produced water day 9 (PW day 9).
Functional annotations were assigned based on the Subsystems database. The affiliations of Level 2 categories to Level 1 categories are coded as follows CS- Clustering based subsystems; C- Carbohydrates; PM- Protein metabolism; DNA- DNA metabolism; R- Respiration; SR- Stress response; SM- Sulfur metabolism; DS- Dormancy and sporulation; IAM- Iron acquisition and metabolism.

