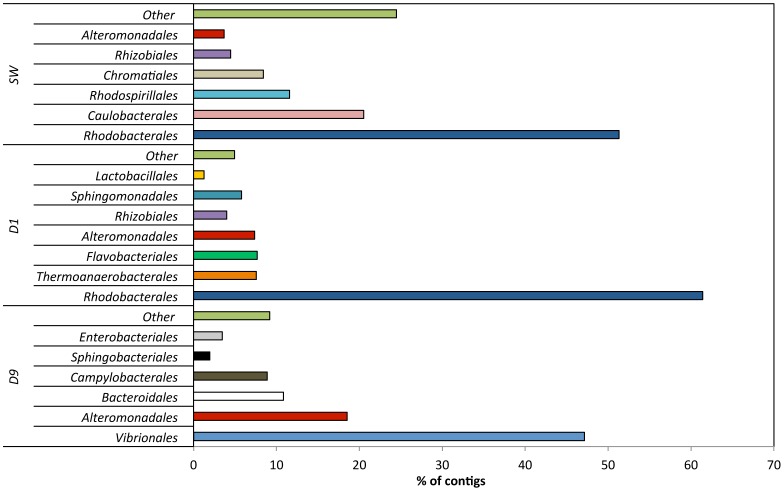
Figure 8. Taxonomic classification of oxidative stress contigs for each analyzed water sample as assigned by MGTAXA.
SW- Source water; D1- Produced water day 1; D9- Produced water day 9. Only the top six bacterial orders to which most contigs were assigned to are shown in the figure. The less abundant bacterial orders are grouped as “other”.

